
Fig. 3
- ID
- ZDB-FIG-211214-6
- Publication
- Gillotay et al., 2020 - Single-cell transcriptome analysis reveals thyrocyte diversity in the zebrafish thyroid gland
- Other Figures
- All Figure Page
- Back to All Figure Page
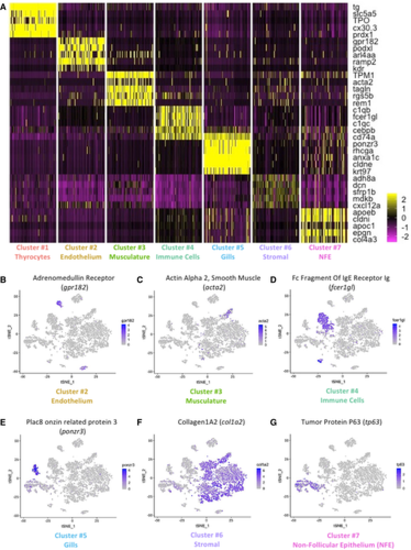
A. Heatmap depicting five genes specifically expressed in each one of the seven clusters of the zebrafish thyroid gland atlas. The color scale represents expression as a z-score ranging from −2 (purple) to 2 (yellow). NFE: Non-Follicular Epithelium. B–G. t-SNE plots overlaid with the expression of a gene specific to each of the cluster. The endothelium cluster (cluster #2) is a mix of blood vessels and lymphatic vessels (see Appendix Fig S4), while the immune cell cluster (cluster #4) is a mix of macrophages, neutrophils, and lymphocytes (see Appendix Fig S5). The color scale represents the normalized expression counts for each gene ranging from lowest (gray) to highest (blue). |