
Fig. 5
- ID
- ZDB-FIG-211214-10
- Publication
- Gillotay et al., 2020 - Single-cell transcriptome analysis reveals thyrocyte diversity in the zebrafish thyroid gland
- Other Figures
- All Figure Page
- Back to All Figure Page
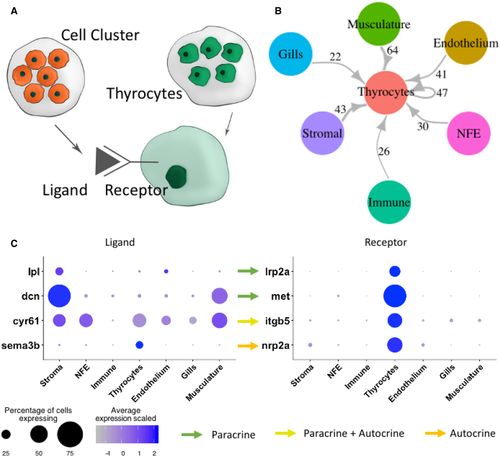
A. To build a connectome for the atlas, the ligands expressed specifically in each cell type were matched with their corresponding receptors in the thyrocytes. B. A highly connected intercellular interaction network is identified by the connectome. The number of ligand–receptor pairs identified between two cell types is denoted alongside the arrows. For NFE, Gills, and Stromal cells, the connectome was restricted to secreted ligands. C. A dotplot depicting examples of paracrine and autocrine signaling in the thyroid gland. The size of the dots represent percentage of cells expressing the gene in a particular cluster, while the color scale represents average expression of the gene in the cluster after scaling. |