
FIGURE
Fig. 3.1
- ID
- ZDB-FIG-211214-7
- Publication
- Gillotay et al., 2020 - Single-cell transcriptome analysis reveals thyrocyte diversity in the zebrafish thyroid gland
- Other Figures
- All Figure Page
- Back to All Figure Page
Fig. 3.1
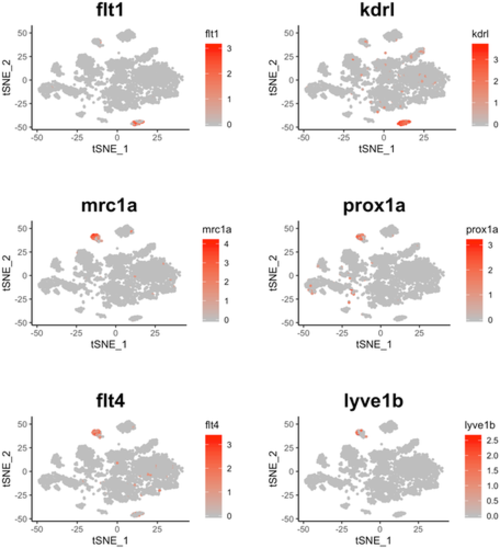
t-SNE plot overlaid with gene expression for genes specific to blood vessels (flt1 and kdrl) and lymphatic vessels (mrc1a, prox1a, flt4, and lyve1b). The color scale represents the normalized expression counts for each gene ranging from lowest (gray) to highest (red). |
Expression Data
Expression Detail
Antibody Labeling
Phenotype Data
Phenotype Detail
Acknowledgments
This image is the copyrighted work of the attributed author or publisher, and
ZFIN has permission only to display this image to its users.
Additional permissions should be obtained from the applicable author or publisher of the image.
Full text @ EMBO Rep.