
Image
|
Figure Caption
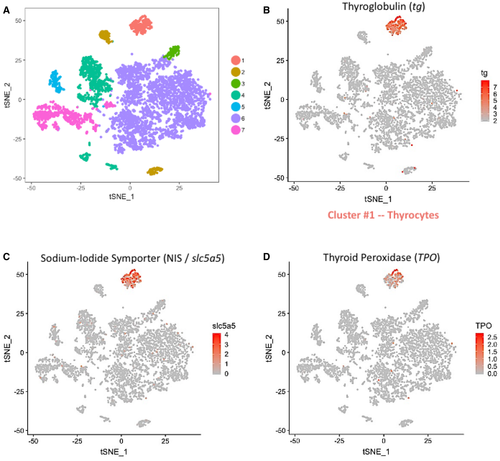
Fig. 2 A. t-SNE plot displaying the 6,249 single cells profiled in the zebrafish thyroid gland atlas. The colors represent cell clusters denoting a specific cell type. B–D. Cluster #1 represents the thyrocytes that express tg, slc5a5 (NIS) and tpo. The color scale represents the normalized expression counts for each gene ranging from lowest (gray) to highest (red).
Acknowledgments
This image is the copyrighted work of the attributed author or publisher, and
ZFIN has permission only to display this image to its users.
Additional permissions should be obtained from the applicable author or publisher of the image.
Full text @ EMBO Rep.