
- Title
-
Disrupted-In-Schizophrenia-1 is essential for normal hypothalamic-pituitary-interrenal (HPI) axis function
- Authors
- Eachus, H., Bright, C., Cunliffe, V.T., Placzek, M., Wood, J.D., Watt, P.J.
- Source
- Full text @ Hum. Mol. Genet.

ZFIN is incorporating published figure images and captions as part of an ongoing project. Figures from some publications have not yet been curated, or are not available for display because of copyright restrictions. |
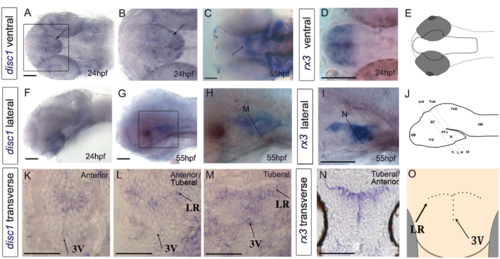
Expression of disc1 in the larval zebrafish brain. (A–J) 24 hpf or 55 hpf embryos after in situ hybridization for disc1 (A–C, F–H) or rx3 (D, I) shown in ventral whole-mount view (A–D) or side view (F–I). Anterior to left. (B,H) show high power views of boxed regions in (A,G). (E,J) show schematic ventral and side views. Arrows point to expression of disc1 in hypothalamus. Lines in side views (H–J) indicate planes of sections shown in (K–N). (K–N) Transverse sections taken through 55 hpf embryos after in situ hybridization for disc1 (K-M) or rx3 (N). Schematic (O) shows position of 3rd ventricle and lateral recesses. Abbreviations: 3V, 3rd ventricle; Ant, anterior; DT, dorsal thalamus; H, hypothalamus; LR, lateral recess; MO, medulla oblongata; OB, olfactory bulb; PO, preoptic region; PTv, ventral posterior tuberculum; TeO, tectum opticum; Tub, tuberal. N = 6 each. Scale bar: 50 μm. |
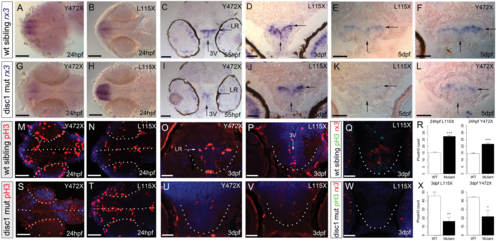
Progenitor cell alterations in the hypothalamus of disc1 L115X and Y472X larvae. (A–L) In situ hybridization for rx3 in wild type (A–F) and disc1 mutant (G–L) larvae in ventral whole-mount views at 24 hpf (A,B,G,H) or representative transverse sections through posterior parts of the tuberal hypothalamus at 55 hpf (C,I), 3 dpf (D,J) and 5 dpf (E,F,K,L). Expression of rx3 is reduced at all-time points in Y472X larvae when compared to wild types (A,C,F,G,I,L). Expression of rx3 is elevated at 24 hpf, then reduced in L115X mutant larvae at later time points, when compared to wild types (B,D,E,H,J,K). In both mutant lines, no rx3 is detected in the 3rd ventricle and the width of rx3 expression across the lateral recess is significantly reduced at 5 dpf (L115X, t test, t = 2.80, df = 22, P=0.010; Y472X, t test, t = 3.51, df = 22, P=0.002). (M–X) Immunohistochemical analyses for phosH3 (M–P,S–V) or dual immunohistochemical/in situ hybridisation analyses for phosH3 and rx3 (Q,W), with DAPI counter-labelling (blue) in wild type (M–Q) and disc1 mutant (S–W) larvae in ventral whole-mount views at 24 hpf (M,N,S,T) or representative transverse sections through posterior parts of the tuberal hypothalamus at 3 dpf (O–Q, U–W). Significantly more phosH3+ cells are detected at 24 hpf (L115X, t test, t = −12.51, df = 6.73, P≤0.0001; Y472X, t test, t = −7.73, df = 7.06, P=0.0001), and significantly fewer phosH3+ cells are detected at 3 dpf in mutant lines compared to wild type siblings (R,X) (L115X, t test, t = 4.58, df = 7.97, P=0.002, Y472X, t test, t = 3.17, df = 4.08, P=0.033). N = 5 each. Arrows point to lateral recess (LR) or 3rd ventricle (3V). In whole-mount views, dotted outlines show developing eyes and ventral midline. In transverse sections, dots outline hypothalamus. Scale bars: 50 μm. |

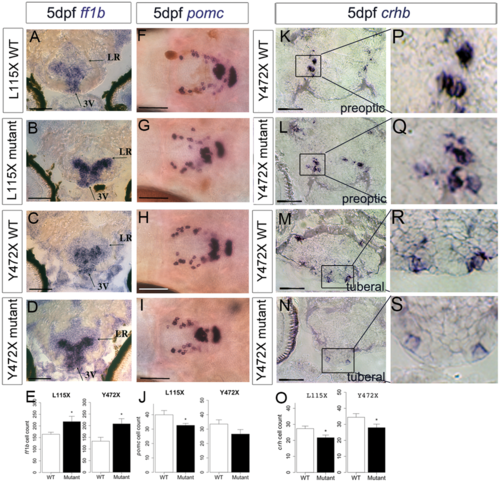
Abnormal neuronal differentiation in the hypothalamus of disc1 L115X and Y472X embryos. (A–D,F–I) Transverse sections through posterior tuberal hypothalamus at 52 hpf after in situ hybridisation with ff1b (nr5a1a) (A–D) or pomc (F-I). ff1b is expressed more strongly in both L115X (B) and Y472X (D) mutant larvae, compared to wild types (A and C). (E,J) Quantitative analyses of ff1b and pomc cell number at 52hpf. ff1b cell count was not different in L115X embryos (t test, t = −2.45, df = 3.86, P=0.073, N = 3), but was significantly increased in Y472X mutants compared to wild types (t test, t = -3.13, df = 14.06, P=0.007, N = 9–10). pomc cell count was not significantly altered in L115X (t test, t = 1.10, df = 5.56, P=0.318, N = 3–5) or Y472X (t test, t = 0.54, df = 25.38, P=0.593, N = 13–16) embryos (J). (K-O) Transverse sections through preoptic (K,L) or posterior tuberal hypothalamus (M,N) at 52 hpf after in situ hybridisation with crhb in the Y472X line. Quantitative analysis (O) shows significantly more crhb+ cells in the preoptic and tuberal hypothalamus of mutant larvae (t test, t = −2.53, df = 7.83, P=0.036). N = 5 each. Abbreviations: 3V, 3rd ventricle of the hypothalamus; LR, lateral recess of the hypothalamus; WT, wild type larvae; mutant, homozygous mutant larvae. Scale bar: 50 μm. |
Abnormal neuronal differentiation in the hypothalamus of disc1 L115X and Y472X larvae. (A–E) Transverse sections (A–D) through posterior tuberal hypothalamus at 5 dpf after in situ hybridisation with ff1b. ff1b is expressed more strongly in both L115X and Y472X mutant larvae, and in more cells (E) compared to wild types (L115X, t test, t = −2.20, df = 11.64, P=0.049, Y472X, t test, t = −2.70, df = 12.91, P=0.018). N = 8–10 each. (F–J) Ventral whole-mount views at 5 dpf after in situ hybridisation with pomc. pomc+ cells are disorganised in the hypothalamus of mutant larvae (G,I) compared to wild type siblings (F,H). (J) Quantitative analysis at 5 dpf shows significantly fewer hypothalamic pomc+ cells in L115X (t test, t = 2.24, df = 21.52, P=0.036, N = 16) mutants compared to wild types, but no significant difference in the Y472X line (t test, t = 1.63, df = 8.79, P=0.139, N = 5–6). (K–O) Transverse sections through preoptic (K, L) or posterior tuberal hypothalamus (M,N) at 5 dpf after in situ hybridisation with crhb in the Y472X line. High power views of boxed regions show weaker expression in mutant particularly in the tuberal region (P–S). Quantitative analysis (O) shows significantly fewer crhb+ cells can be detected in the preoptic and tuberal hypothalamus of both lines mutant larvae (L115X: t test, t = −2.47, df = 21.95, P=0.022; Y472X: t test, t = −2.08, df = 23.85, P=0.049. N = 11–14 each. Abbreviations: 3V, 3rd ventricle of the hypothalamus; LR, lateral recess of the hypothalamus; WT, wild type larvae; mutant, homozygous mutant larvae. Scale bar: 50 μm. |
|
ZFIN is incorporating published figure images and captions as part of an ongoing project. Figures from some publications have not yet been curated, or are not available for display because of copyright restrictions. PHENOTYPE:
|
|
ZFIN is incorporating published figure images and captions as part of an ongoing project. Figures from some publications have not yet been curated, or are not available for display because of copyright restrictions. PHENOTYPE:
|
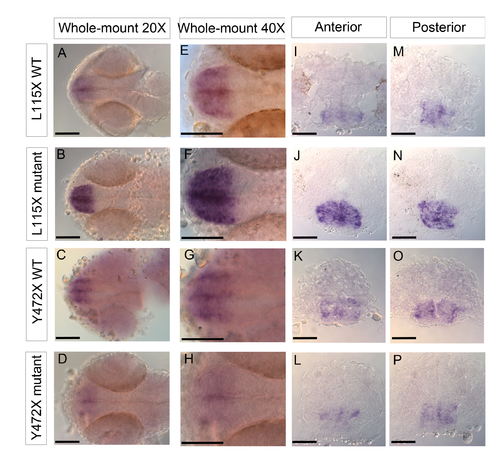
Expression of rx3 by in situ hybridization in 24 hpf disc1 embryos. (A-H) Ventral whole-mount view of rx3 in the developing hypothalamus, showing increased expression in L115X mutants (B,F) compared to wild types (A,E) and reduced expression in Y472X mutants (D,H) compared with wild type embryos (C,G). (A-D) are 20X magnification, (E-H) are 40X magnification. Anterior left. (I-P) Representative transverse sections through the anterior (I-L) and posterior (M-P) regions of the developing hypothalamus in L115X (I, J, M, N) and Y472X (K, L, O, P) embryos. Scale bars: 50 μm. |
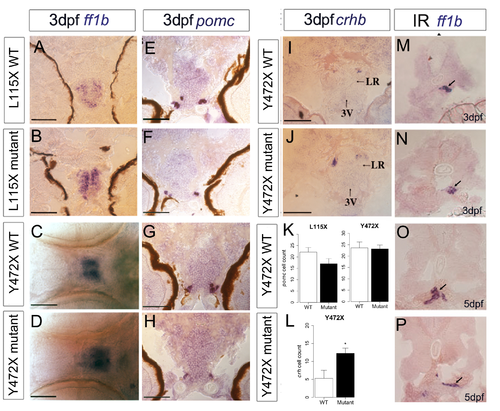
Expression of markers of hypothalamic neurons and steroidogenic cells in disc1 larvae. (A-D) Expression of ff1b in the hypothalamus of 3 dpf disc1 larvae shown in transverse section in the L115X line (A, B) and ventral whole-mount view in the Y472X line (C, D, anterior left). (E-H, K) Expression of pomc in the hypothalamus of 3 dpf L115X (E-F) and Y472X (G-H) larvae in transverse sections. (K) Quantitative analysis of pomc cell count in 3 dpf disc1 larvae showed no significant difference (L115X, t test, t=-1.71, df=21.54, p=0.103; Y472X, t test, t=0.13, df=19.08, p=0.895) N=11-14. (I-J, L) Expression of crhb in the preoptic and anterior hypothalamus of 3 dpf Y472X larvae. Quantitative analysis revealed significantly more crhb cells in Y472X mutants (t test, t=-2.61, df=10.70, p=0.025). N=7-11 each. (M-P) Expression of ff1b in the interrenal tissue (arrows) of disc1 Y472X larvae shown in transverse sections at 3 dpf (M, N) and 5 dpf (O, P). N = 6 each. Scale bars: 50 μm. 3V, 3rd ventricle, LR, lateral recess, IR, interrenal tissue. |
|
Unillustrated author statements PHENOTYPE:
|