
|
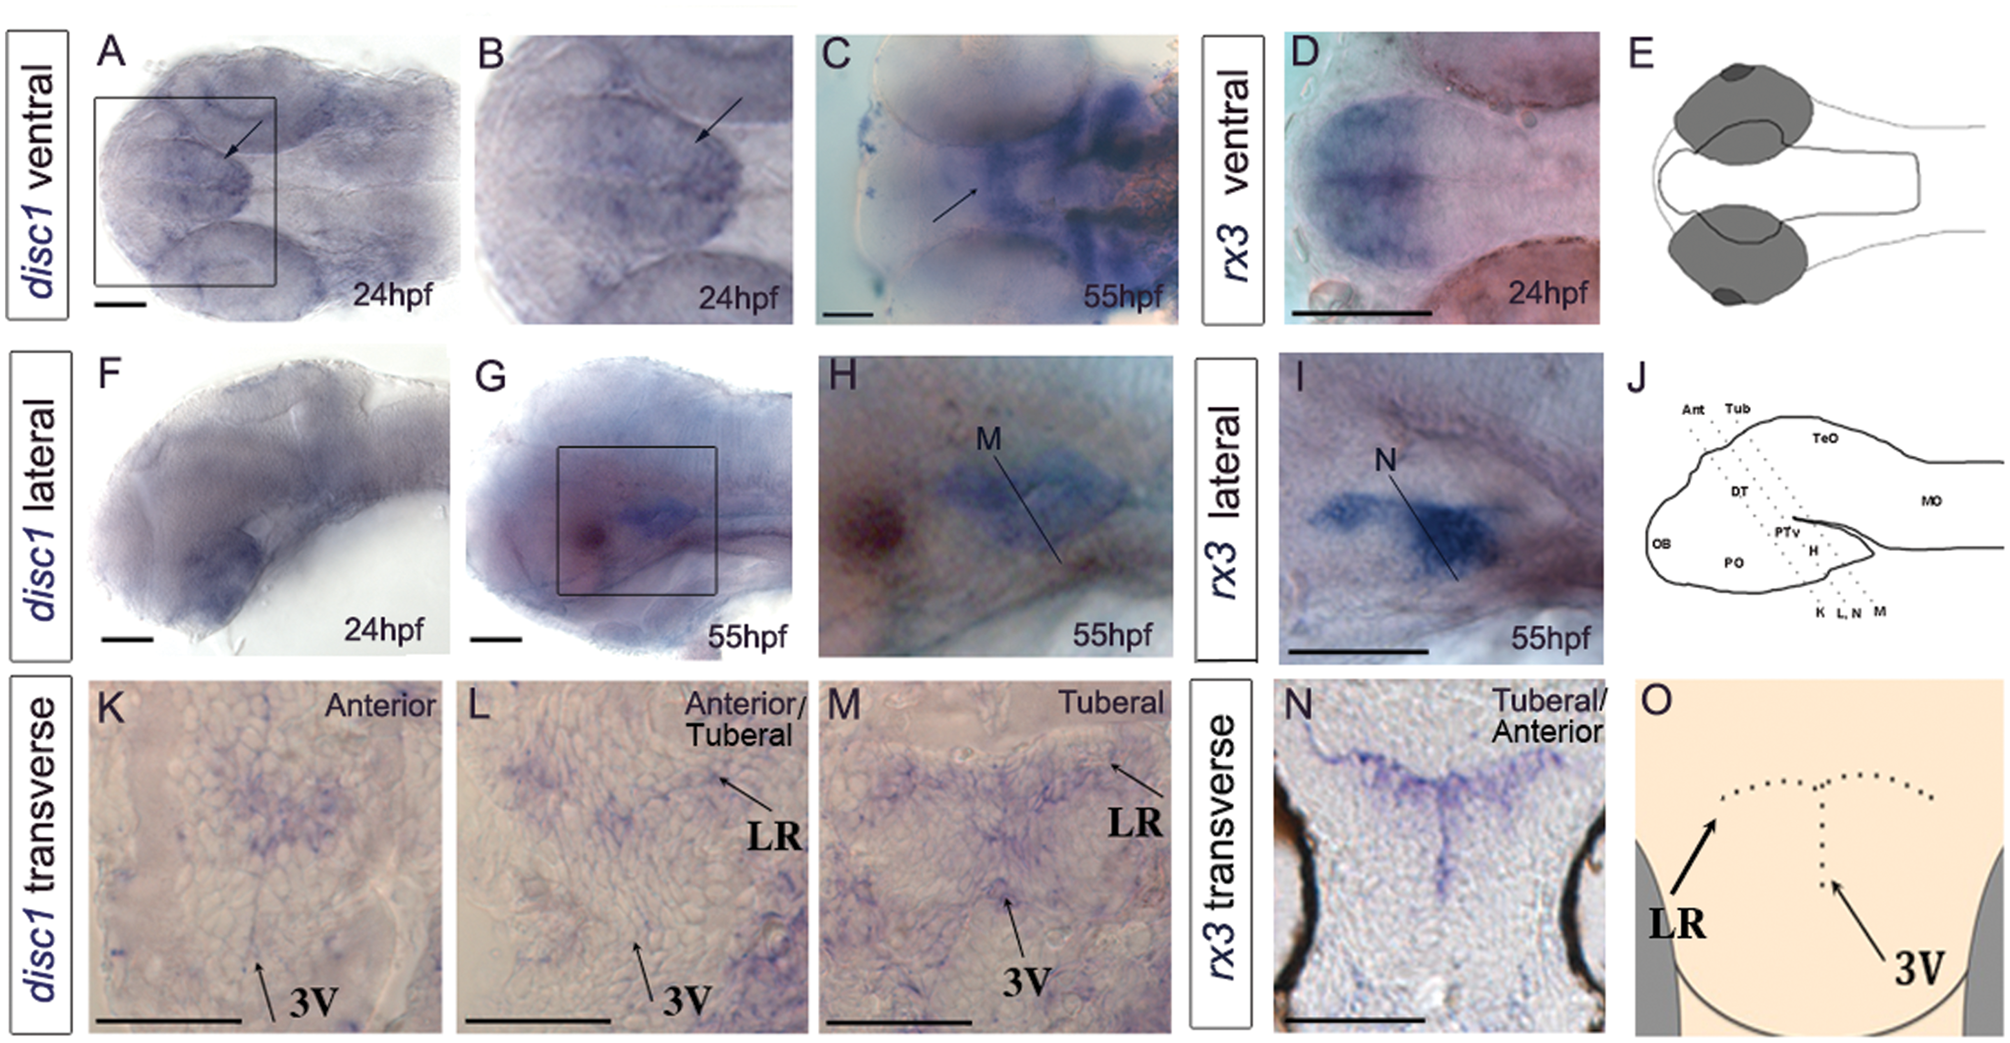
Fig. 2
Expression of disc1 in the larval zebrafish brain. (A–J) 24 hpf or 55 hpf embryos after in situ hybridization for disc1 (A–C, F–H) or rx3 (D, I) shown in ventral whole-mount view (A–D) or side view (F–I). Anterior to left. (B,H) show high power views of boxed regions in (A,G). (E,J) show schematic ventral and side views. Arrows point to expression of disc1 in hypothalamus. Lines in side views (H–J) indicate planes of sections shown in (K–N). (K–N) Transverse sections taken through 55 hpf embryos after in situ hybridization for disc1 (K-M) or rx3 (N). Schematic (O) shows position of 3rd ventricle and lateral recesses. Abbreviations: 3V, 3rd ventricle; Ant, anterior; DT, dorsal thalamus; H, hypothalamus; LR, lateral recess; MO, medulla oblongata; OB, olfactory bulb; PO, preoptic region; PTv, ventral posterior tuberculum; TeO, tectum opticum; Tub, tuberal. N = 6 each. Scale bar: 50 μm.