
|
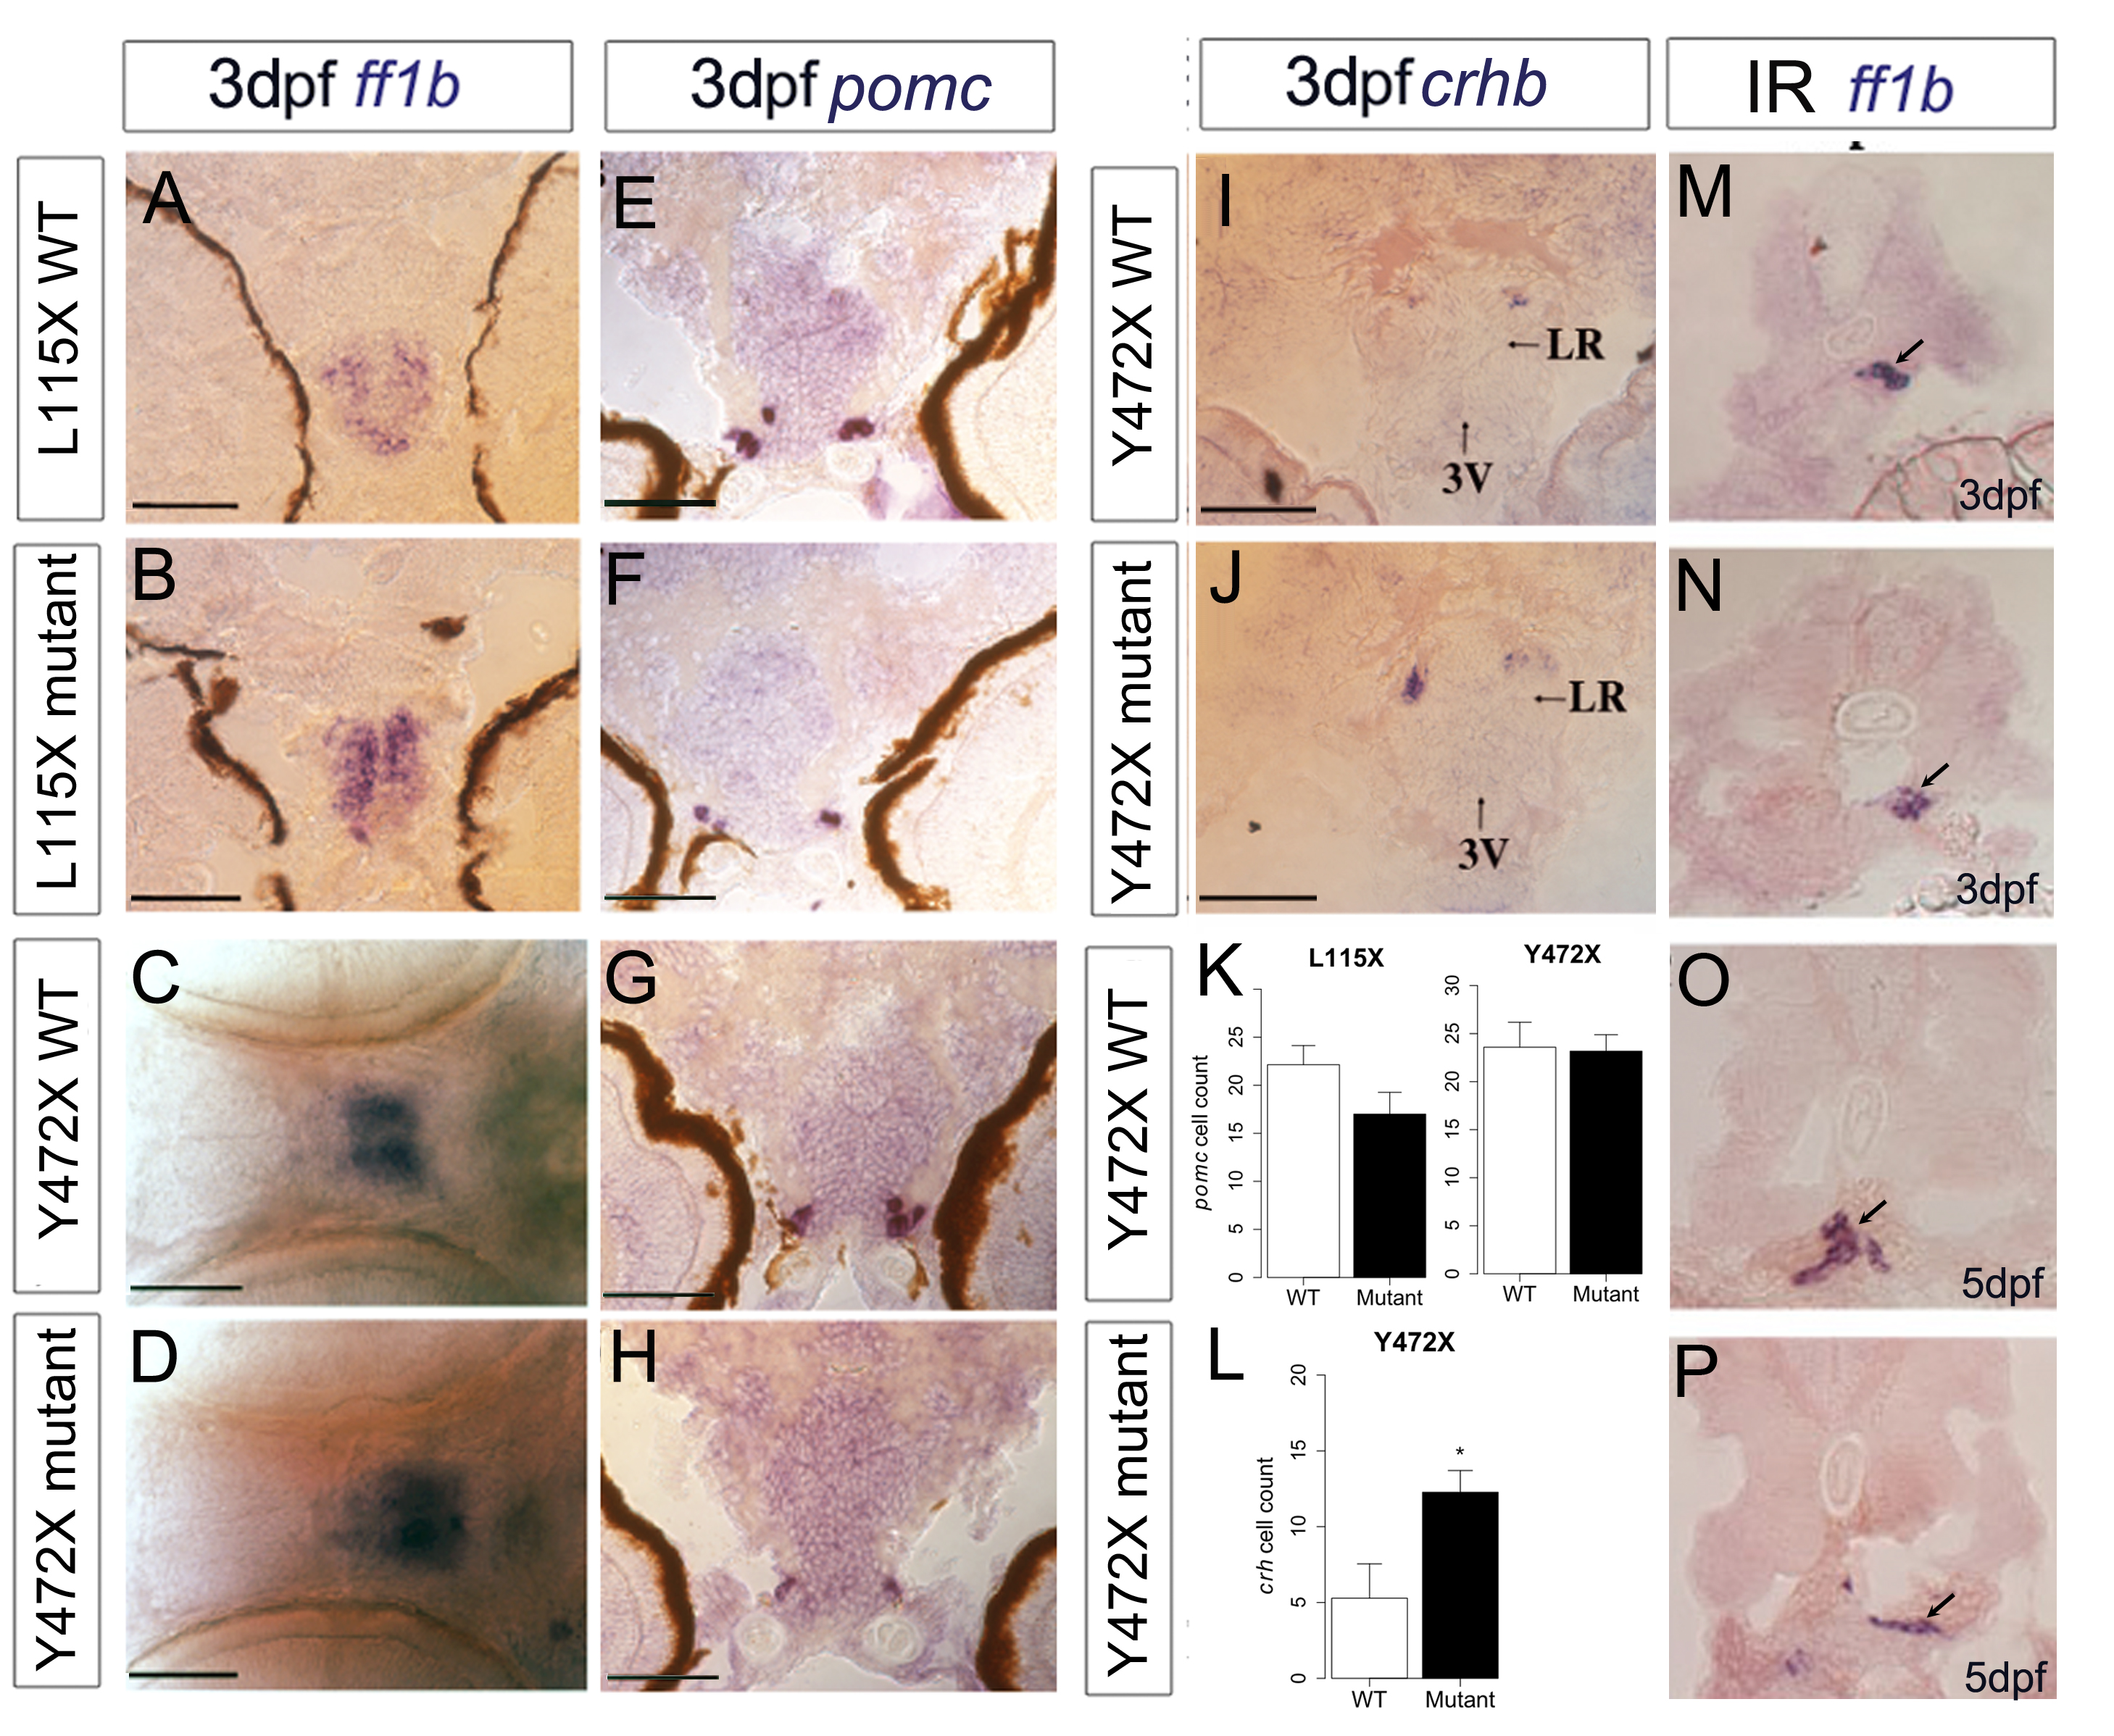
Fig. S2
Expression of markers of hypothalamic neurons and steroidogenic cells in disc1 larvae. (A-D) Expression of ff1b in the hypothalamus of 3 dpf disc1 larvae shown in transverse section in the L115X line (A, B) and ventral whole-mount view in the Y472X line (C, D, anterior left). (E-H, K) Expression of pomc in the hypothalamus of 3 dpf L115X (E-F) and Y472X (G-H) larvae in transverse sections. (K) Quantitative analysis of pomc cell count in 3 dpf disc1 larvae showed no significant difference (L115X, t test, t=-1.71, df=21.54, p=0.103; Y472X, t test, t=0.13, df=19.08, p=0.895) N=11-14. (I-J, L) Expression of crhb in the preoptic and anterior hypothalamus of 3 dpf Y472X larvae. Quantitative analysis revealed significantly more crhb cells in Y472X mutants (t test, t=-2.61, df=10.70, p=0.025). N=7-11 each. (M-P) Expression of ff1b in the interrenal tissue (arrows) of disc1 Y472X larvae shown in transverse sections at 3 dpf (M, N) and 5 dpf (O, P). N = 6 each. Scale bars: 50 μm. 3V, 3rd ventricle, LR, lateral recess, IR, interrenal tissue.