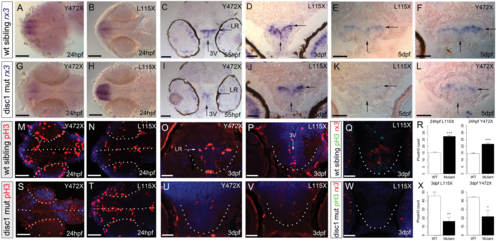
Progenitor cell alterations in the hypothalamus of disc1 L115X and Y472X larvae. (A–L) In situ hybridization for rx3 in wild type (A–F) and disc1 mutant (G–L) larvae in ventral whole-mount views at 24 hpf (A,B,G,H) or representative transverse sections through posterior parts of the tuberal hypothalamus at 55 hpf (C,I), 3 dpf (D,J) and 5 dpf (E,F,K,L). Expression of rx3 is reduced at all-time points in Y472X larvae when compared to wild types (A,C,F,G,I,L). Expression of rx3 is elevated at 24 hpf, then reduced in L115X mutant larvae at later time points, when compared to wild types (B,D,E,H,J,K). In both mutant lines, no rx3 is detected in the 3rd ventricle and the width of rx3 expression across the lateral recess is significantly reduced at 5 dpf (L115X, t test, t = 2.80, df = 22, P=0.010; Y472X, t test, t = 3.51, df = 22, P=0.002). (M–X) Immunohistochemical analyses for phosH3 (M–P,S–V) or dual immunohistochemical/in situ hybridisation analyses for phosH3 and rx3 (Q,W), with DAPI counter-labelling (blue) in wild type (M–Q) and disc1 mutant (S–W) larvae in ventral whole-mount views at 24 hpf (M,N,S,T) or representative transverse sections through posterior parts of the tuberal hypothalamus at 3 dpf (O–Q, U–W). Significantly more phosH3+ cells are detected at 24 hpf (L115X, t test, t = −12.51, df = 6.73, P≤0.0001; Y472X, t test, t = −7.73, df = 7.06, P=0.0001), and significantly fewer phosH3+ cells are detected at 3 dpf in mutant lines compared to wild type siblings (R,X) (L115X, t test, t = 4.58, df = 7.97, P=0.002, Y472X, t test, t = 3.17, df = 4.08, P=0.033). N = 5 each. Arrows point to lateral recess (LR) or 3rd ventricle (3V). In whole-mount views, dotted outlines show developing eyes and ventral midline. In transverse sections, dots outline hypothalamus. Scale bars: 50 μm.
|
