
- Title
-
Cannabinoid receptor signaling regulates liver development and metabolism
- Authors
- Liu, L.Y., Alexa, K., Cortes, M., Schatzman-Bone, S., Kim, A.J., Mukhopadhyay, B., Cinar, R., Kunos, G., North, T.E., Goessling, W.
- Source
- Full text @ Development
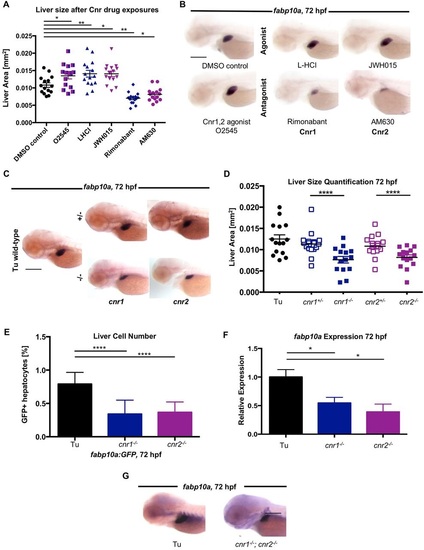
Chemical and genetic modulation of endocannabinoid (EC) signaling alters liver size and cell number during zebrafish development. (A) Quantification of liver size in DMSO-treated and Cnr agonist/antagonist-treated WT embryos from 18-72hpf. Agonists (O2545, L-HCl, JWH015) increased, whereas antagonists (rimonabant, AM630) decreased, liver size. **P<0.01, DMSO versus L-HCl or rimonabant; *P<0.05, DMSO versus O2545, JWH015 or AM630. (B) Representative ISH images for fabp10a in zebrafish embryos after treatment with cannabinoid drugs from 18-72hpf. (C) Representative ISH images showing decreased fabp10a expression in cnr1-/- and cnr2-/- mutants compared with WT and heterozygous siblings. (D) Quantification of liver size by measurement of fabp10a expression area after ISH in WT (Tu), heterozygous, and homozygous cnr1-/- and cnr2-/- mutants at 72hpf. Results represent one independent experiment of triplicate experiments yielding similar results. ****P<0.0001, for cnr1+/- versus cnr1-/- and for cnr2+/- versus cnr2-/-. (E) FACS quantification of fabp10a:GFP hepatocyte number in WT compared with cnr1-/- and cnr2-/- mutants at 72hpf. The fraction of GFP+ cells was normalized to controls. n=3 pooled samples of ten embryos. ****P<0.0001, fabp10a:GFP versus cnr1-/- and cnr2-/-. (F) Quantification of fabp10a expression in WT and Cnr mutants by qRT-PCR at 72hpf. n=3 pooled samples of 20 embryos. *P<0.05. (G) ISH for fabp10a in cnr1-/-; cnr2-/- double mutants at 72hpf. All error bars show mean±s.e.m. P-values by one-way ANOVA. Scale bars: 0.2mm. EXPRESSION / LABELING:
PHENOTYPE:
|
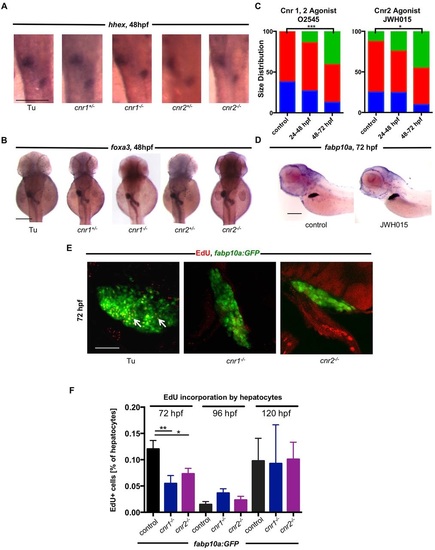
Hepatocyte proliferation is disrupted in Cnr mutants without impairment of hepatic progenitors. (A) ISH for hhex at 48hpf in WT (16 abnormal/89 observed), cnr1+/- (6/28 abnormal), cnr2+/- (5/32 abnormal), cnr1-/- (19/70 abnormal) and cnr2-/- (7/35 abnormal) embryos, revealing no significant differences in the hepatic progenitor population. (B) foxa3 ISH at 48hpf in WT (19/96 abnormal), cnr1+/- (4/29 abnormal), cnr2+/- (5/30 abnormal), cnr1-/- (12/54 abnormal) and cnr2-/- (4/40 abnormal) embryos, showing no differences in the endoderm population. (C) Relative frequency of liver size distribution of zebrafish embryos treated with Cnr agonists during different stages of liver development, as assessed by fabp10a expression at 72hpf. Treatment with the Cnr1/2 agonist O2545 (1µM) or the Cnr2 agonist JWH015 (1µM) only from 48-72hpf increased liver size, whereas earlier treatment had no effect. Normal liver size, red; small liver, blue; large liver, green. n>30 embryos. Chi-squared analysis. O2545, ***P<0.001 control versus 48-72hpf treatment; JWH015, *P<0.05 control versus 48-72hpf treatment. (D) Treatment with JWH015 from 48-72hpf increases fabp10a expression in zebrafish embryos at 72hpf. (E) Confocal projections of fabp10a:GFP livers at 72hpf after EdU incorporation. EdU-positive hepatocytes are represented by colocalization (arrows) of red EdU staining and hepatocyte-specific GFP expression. (F) FACS quantification of EdU-positive cells as a percentage of the GFP+ population at 72, 96 and 120hpf. At 72hpf there is less EdU incorporation compared with controls, indicating a decreased proliferation rate. At 96 and 120hpf, there is no difference in the proliferation rate. Mean±s.e.m., n=3-8 samples of ten pooled embryos. One-way ANOVA with Holm-Sidak′s multiple comparison test. At 72hpf, *P<0.01 for control versus cnr1-/-; fabp10a:GFP and **P<0.05 for control versus cnr2-/-; fabp10a:GFP. Scale bars: 0.2mm in A,B,D; 20µm in E. EXPRESSION / LABELING:
PHENOTYPE:
|
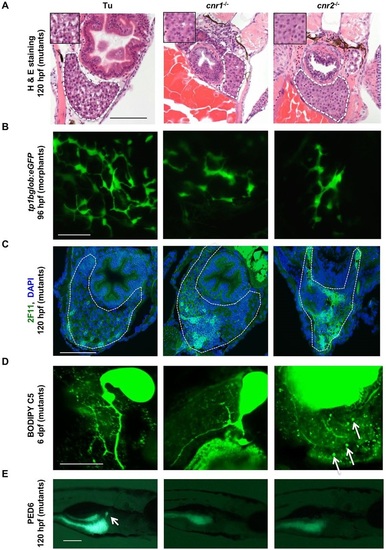
Livers in Cnr mutants eventually develop to normal size but continue to exhibit architectural and metabolic defects. (A) H&E-stained transverse sections through 120hpf larvae reveal altered hepatocyte morphology in cnr1-/- and cnr2-/- mutants, with more dense cytoplasm and decreased nucleus-to-cytoplasm ratios compared with WT, but no difference in hepatocyte size. Liver is outlined (white dashed line) and inset shows hepatocytes at higher magnification. (B) Confocal projections at 96hpf in cnr1 or cnr2 morphants in the tp1bglob:eGFP Notch transgenic background, showing smaller liver size and decreased biliary branching and bile duct formation versus the control (6/10 cnr1 morphants, 6/8 cnr2 morphants). (C) Transverse sections of 120hpf larvae stained with the biliary marker 2F11 and DAPI show an abnormal biliary tree in cnr1-/- (6/8 abnormal) and cnr2-/- (3/4 abnormal) livers. Liver region is outlined. (D) Confocal microscopy of livers in WT, cnr1-/- and cnr2-/- larvae at 6dpf, showing metabolism of BODIPY C5 throughout the biliary tree. cnr1-/- larvae have decreased biliary branching (n=6/8 with phenotype of this representative image), while cnr2-/- livers are characterized by lipid deposits (arrows, n=7 /10 abnormal), as compared with WT (0/12). (E) PED6 lipase reporter assay in cnr1-/- (n=18/40 abnormal) and cnr2-/- (n=7/24 abnormal) mutants demonstrates decreased fluorescence compared with controls (n=0/24 abnormal) at 120hpf. Fisher′s exact test. cnr1-/- versus WT, P<0.0001; cnr2-/- versus WT, P=0.0094. Arrow marks the gallbladder, which does not fluoresce in the mutants. Scale bars: 0.1mm in A,C; 20µm in B,D; 0.2mm in E. |

Metabolic dysregulation and aberrant histological features persist in adult Cnr mutants. (A) H&E-stained adult liver sections show evidence of cholestasis (inset) and inflammatory infiltrates in cnr1-/- mutants. cnr2-/- mutants exhibit abnormal cellular morphology with increased open cytoplasm, suggesting extensive steatosis. (B) Adult liver sections stained for biliary marker 2F11 and with DAPI reveal decreased biliary tree formation in cnr1-/- mutants and cholestatic deposits (arrows) in cnr2-/- mutants. (C) Serum triglyceride content in male (C) and female (D) mutants. Adult cnr2-/- zebrafish have doubled triglyceride levels compared with WT and cnr1-/-. Mean±s.e.m.; n>5. One-way ANOVA. **P<0.01 for WT versus cnr2-/-. Scale bars: 0.1mm. |

ZFIN is incorporating published figure images and captions as part of an ongoing project. Figures from some publications have not yet been curated, or are not available for display because of copyright restrictions. |

Treatment with methionine and cysteine can rescue liver development defects in Cnr mutants. (A) Scatter plot of liver morphometric measurements of cnr1-/- and cnr2-/- mutants after 100µM methionine or cysteine versus DMSO exposure from 24-72hpf. Results shown represent one independent experiment of triplicate experiments yielding similar results. Mean±s.e.m.; n>15. One-way ANOVA. ***P<0.001, cnr1-/- methionine versus control; **P<0.01, cnr2-/- methionine versus control; *P<0.05, cnr2-/- cysteine versus control. (B) fabp10a expression at 72hpf in cnr1-/- embryos after DMSO, methionine or cysteine exposure from 24-72hpf. (C) H&E staining of transverse sections of 120hpf larvae shows that treatment of cnr1-/- and cnr2-/- mutants with methionine partially restores WT liver histology. cnr1-/-, 6 abnormal/9; cnr1-/-+methionine, 5 normal/7; P=0.065 (Chi-square). cnr2-/-, 6 abnormal/9; cnr2-/-+methionine, 6 normal/8; P=0.043 (Chi-square). (D) Confocal microscopy images of livers in cnr2-/- larvae after BODIPY C5 incorporation with and without methionine treatment. Extensive biliary branching is observed in WT larvae, and decreased branching with lipid and cholestatic deposition in cnr2-/- mutants (7 abnormal/10). Treatment of cnr2-/- mutants with methionine causes increased biliary branching and decreased lipid accumulation (2 abnormal/6). (E) Percentage of larvae with fatty liver after ethanol-induced liver injury and with methionine or cysteine treatment for cnr1-/- and cnr2-/- larvae at 120hpf. n>30 samples. Fisher′s exact test. *P<0.05 and **P<0.01 for methionine and cysteine versus DMSO. (F) ORO stain in cnr2-/- embryos at 120hpf after 2% ethanol exposure alone or co-treated with 100µM methionine or cysteine from 96-120hpf. Liver region is outlined. (G) H&E staining of liver sections in 2-month-old male zebrafish. cnr2 morphant liver histology appears similar to that of WT; cnr2-/- and cnr1-/-; cnr2-/- double mutants have decreased cytoplasmic hepatocyte staining. Early methionine treatment of cnr2-/- mutants had no effect on liver histology; however, daily methionine altered histological appearance towards WT features, with increased cytoplasmic staining and decreased cytoplasm-to-nucleus ratios. n=5/group. Scale bars: 0.2mm in B,F; 0.1mm in C; 20µm in D; 50µm in G. EXPRESSION / LABELING:
PHENOTYPE:
|
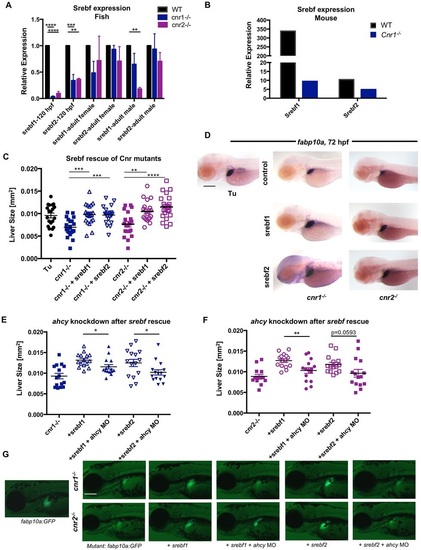
EC signaling regulates methionine metabolism via Srebfs in Cnr mutants. (A) srebf1 and srebf2 expression in pooled WT, cnr1-/- and cnr2-/- zebrafish embryos at 120hpf, and in adult livers, quantified by qRT-PCR. Data analyzed using the ΔΔCt method. Mean±s.e.m.; n=3 pooled biological samples of 20 embryos each. One-way ANOVA. ****P<0.0001, ***P<0.001 and **P<0.01 for srebf1 or srebf2 expression in mutants versus WT. (B) Srebf1 and Srebf2 expression in male Cnr1-/- mice. n=6. (C,D) Scatter plot of liver morphometric measurements (C) and fabp10a ISH (D) at 72hpf in cnr1-/- and cnr2-/- mutants with and without overexpression of srebf1 and srebf2 mRNA. Results shown represent one independent experiment of triplicate experiments which yielded similar results. Mean±s.e.m.; n>15. One-way ANOVA. ***P<0.001 for cnr1-/- control versus srebf1 or srebf2 overexpression; **P<0.01 for cnr2-/- control versus srebf1 overexpression; ****P<0.0001 for cnr2-/- control versus srebf2 overexpression. (E-G) Scatter plot of liver morphometric measurements (E,F) and live imaging (G) of cnr1-/-; fabp10a:GFP and cnr2-/-; fabp10a:GFP at 72hpf with overexpression of srebf1 and srebf2 in the presence and absence of concurrent ahcy morpholino knockdown. Results represent one independent experiment of triplicate experiments yielding similar results. Mean±s.e.m.; n>15. Student′s t-test. *P<0.05 in cnr1-/- background (E); **P<0.01 in cnr2-/- background (F). Scale bars: 0.2mm. EXPRESSION / LABELING:
PHENOTYPE:
|
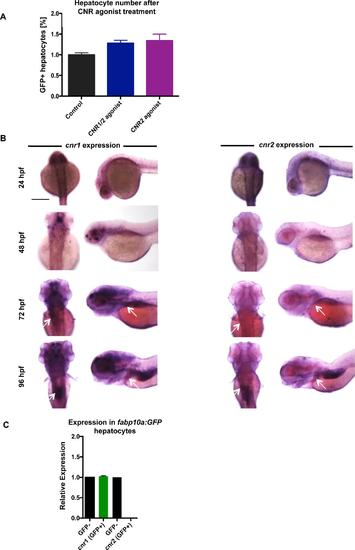
Cannabinoid receptor expression in the developing zebrafish A) FACS quantification of GFP-positive hepatocytes in fabp10a:GFP embryos treated with cannabinoid agonists from 24-72hpf. % of GFP positive cells were normalized to controls. Mean±s.e.m., n=5 groups of 10 pooled embryos; p=0.08, one-way ANOVA analysis. B) Dorsal and lateral in situ hybridization images at 24, 48, and 72hpf showing that cnr1 and cnr2 are expressed in the developing central nervous system, endoderm (arrow), and liver regions (arrow). Scale bar = 0.2 mm. C) qRT-PCR detects cnr1 expression in pooled FACS-sorted GFP-positive cells (~200,000 cells) from wild type fabp10a:GFP normalized to expression in the GFP-negative cell fraction, which includes the central nervous system. cnr2 is detectable in the non-hepatocyte (GFP-negative) fraction, but not in the hepatocytes. PHENOTYPE:
|

Characterization of cannabinoid receptor mutants and morphants A) FACS quantification of fabp10a:GFP embryos injected with cnr1 and cnr2 morpholinos. Morphant embryos at 72hpf show a decreased number of GFP-positive hepatocytes. Mean±s.e.m., n=5 groups of 10 pooled embryos; p=0.18, one-way ANOVA analysis.B) Fluorescent micrographs showing that morpholino knockdown of cnr1 or cnr2 in fabp10a:GFP reporter fish leads to smaller livers at 72hpf. Scale bar = 0.2 mm. C) Depiction of wild type and mutant sequence of the TALEN target region in the cnr1 and cnr2 genes. D) Small deletions in the DNA sequence lead to an early stop codon in the first exon of both cnr1 and cnr2. E) Brightfield images of cnr1-/- and cnr2-/- zebrafish at 72hpf reveal no gross anatomical abnormalities or significant developmental delay compared to wild type animals. Scale bar = 0.2 mm. F) H & E staining of transverse sections in 120hpf larvae reveals similarly abnormal liver histology in cnr1-/-; cnr2-/- double mutants compared to histology found in the cnr1-/- and cnr2-/- single mutants shown in Figure 3A. Scale bar = 0.1 mm. |
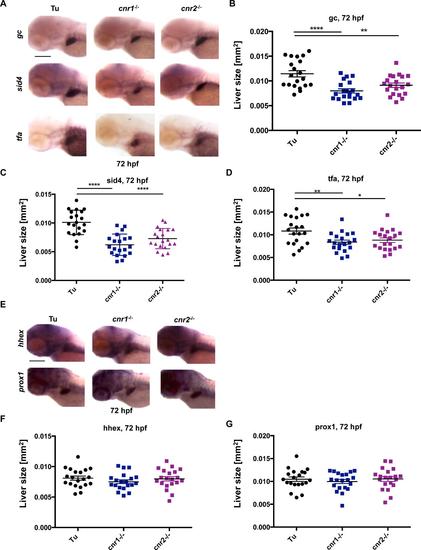
Examination of additional hepatic markers in cnr1-/- and cnr2-/- mutants A) Representative in situ hybridization images and scatter plots quantifying (B-D) expression of additional hepatocyte markers in cnr1-/- and cnr2-/- mutants at 72hpf. Expression of group specific component (vitamin D binding protein, gc), secreted immunoglobulin domain 4 (sid4), and transferrin (tfa) were all reduced in cnr1-/- and cnr2-/- mutants. These results confirm smaller liver size and exclude a dependence on fabp10a expression when cannabinoid receptors are knocked out in these mutants. Data are represented as mean±s.e.m. with one-way ANOVA analysis. Results shown represent one independent experiment of triplicate experiments which yielded similar results, n >15 for each experiment, *p<0.05, **p<0.01, ***p<0.001, ****p<0.0001. Scale bar = 0.2 mm. E) Representative in situ hybridization images and scatter plots quantifying (F-G) expression of hepatic progenitor markers hhex and prox1 at 72hpf. Hepatic progenitors remain unchanged in cnr1-/- and cnr2-/- mutants at 72hpf. These data indicate that disruption of signaling through cannabinoid receptors impacts hepatic differentiation. Data are represented as mean±s.e.m. with one-way ANOVA analysis. Results shown represent one independent experiment of triplicate experiments which yielded similar results, n >15 for each experiment, p=0.42 and p=0.68 for hhex and prox1, respectively. Scale bar = 0.2 mm. |
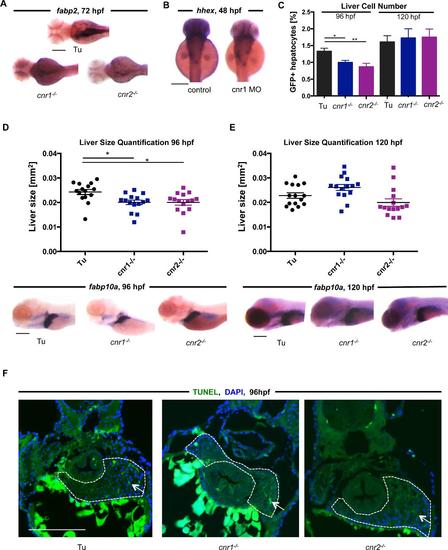
Mechanisms of liver size changes in cannabinoid receptor mutants A) in situ hybridization shows reduction in the intestinal reporter fabp2 in cnr1-/- (62.5% with phenotype, n=40) and cnr2-/- mutants at 72hpf (57.1% with phenotype, n-56). Scale bar = 0.2 mm. B) in situ hybridization images depict the size distribution of hhex expression after morpholino knockdown of cnr1 and cnr2. Morphant embryos do not exhibit differences in hhex liver progenitor expression. Scale bar = 0.2 mm. C) FACS quantification of fabp10a:GFP WT embryos compared to cnr1-/- and cnr2-/- mutants at 96 and 120hpf. % of GFP+ cells were normalized to controls. Mean±s.e.m. n= 7-10 pooled samples of 10 embryos each, one-way ANOVA analysis, *p<0.05 fabp10a:GFP vs. cnr1-/- and **p<0.01 fabp10a:GFP vs cnr2-/-. D - E) Scatter plot and representative in situ hybridization images showing liver size of cnr1-/- and cnr2-/- mutants at 96hpf (C) and 120hpf (D) based on liver morphometric measurements using ImageJ. At 96hpf, livers in mutants are still significantly smaller than controls, but this difference disappears by 120hpf. Data are represented as mean±s.e.m. with one-way ANOVA analysis, *p<0.05 for Tu compared to cnr1-/- and cnr2-/- at 96hpf only. Scale bar = 0.2 mm. F) TUNEL staining in 96hpf embryos reveals no difference in cell death in the developing livers (outlined) of wild type (4.6% TUNEL positive cells, marked by white arrows) compared to cnr1- /- (3.9%) and cnr2-/- mutants (3.0%), indicating that cell death does not substantially contribute to small liver size in cannabinoid receptor mutants. Percentages represent average of n=3, Scale bar = 0.2 mm. |
|
ZFIN is incorporating published figure images and captions as part of an ongoing project. Figures from some publications have not yet been curated, or are not available for display because of copyright restrictions. EXPRESSION / LABELING:
PHENOTYPE:
|
|
ZFIN is incorporating published figure images and captions as part of an ongoing project. Figures from some publications have not yet been curated, or are not available for display because of copyright restrictions. EXPRESSION / LABELING:
PHENOTYPE:
|