
- Title
-
Augmenter of Liver Regeneration (alr) Promotes Liver Outgrowth during Zebrafish Hepatogenesis
- Authors
- Li, Y., Farooq, M., Sheng, D., Chandramouli, C., Lan, T., Mahajan, N.K., Kini, R.M., Hong, Y., Lisowsky, T., and Ge, R.
- Source
- Full text @ PLoS One

ZFIN is incorporating published figure images and captions as part of an ongoing project. Figures from some publications have not yet been curated, or are not available for display because of copyright restrictions. |
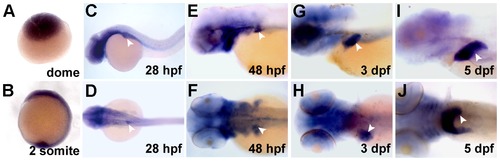
Expression of alr during zebrafish embryonic development. Whole mount in situ hybridization (WISH) shows expression of alr mRNA at different embryonic stages. During early stages, expression of alr is ubiquitous (A, B). Expression in the brain and pharyngeal arches are also observed (C, D, J). From 28 hpf onwards, the expression of alr is detected in liver (white arrow head) throughout hepatogenesis (C–J). C, E, G, I: lateral view, anterior to the left; D, F, H, J: dorsal view, anterior to the left. |
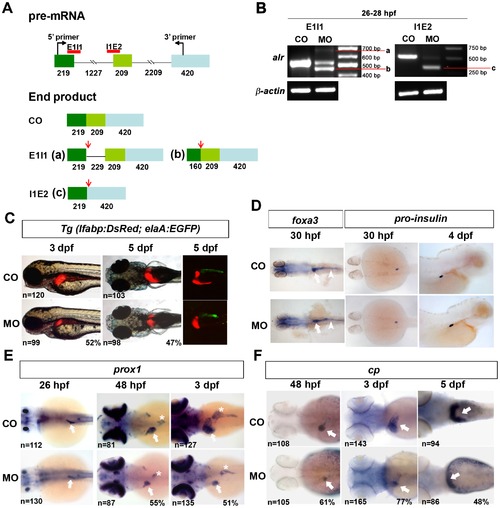
Knockdown of alr by antisense morpholino oligonucleotide inhibits liver growth. A. Schematic presentation of alr pre-mRNA and morpholino design. alr pre-mRNA consists of 3 exons (shown by squares) and 2 introns (shown by lines). The number of nucleotides in each region is labeled below the region. The red lines indicate the targeting sites of the two splicing inhibiting morpholinos, E1I1 and I1E2. In 5-bp mismatch control morpholino injected embryos (CO), splicing of alr pre-mRNA is not affected. In E1I1 morpholino injected embryos, two alternative splicing sites are used. One of the alternative splicing sites is at 229 bp downstream of the 52 boarder of intron 1, generating mRNA product a; the other alternative splicing site is in exon 1, 160 bp downstream of the 52 end of exon 1, producing the mRNA product b. In I1E2 morphants, E1I1 splicing site and I2E3 splicing site will join together and generate mRNA c (with exon 2 removed). The red arrows show the stop codons present in these alternatively spliced mRNAs. B. RT-PCR results demonstrate the potent knockdown of endogenous alr mRNA by the splicing morpholinos. Bands a, b and c are described in Fig. 3A. Morpholinos were injected at 5 ng per embryo, and total RNA was extracted from these embryos at 26–28 hpf. CO, 5-bp mismatch morpholino injected embryos; MO, morpholino injected embryos. β-actin was used as internal control for RT-PCR. C. Knockdown of alr suppressed liver growth in Tg(lfabp:DsRed;elaA:EGFP) embryos. Three morpholinos showed similar phenotype, and the photos shown are from translation blocking morpholino injected embryos. Liver size (red color) was reduced significantly in MO, compared to CO. In the right panel, confocal fluorescent images show suppressed liver (red) and exocrine pancreas (green). All images are anterior to the left, side view for 3 dpf embryos, dorsal view for 5 dpf embryos. D. Knockdown of alr did not affect intestine and endocrine pancreas formation. Intestine was marked by WISH using pan-endoderm marker foxa3. Endocrine pancreas was shown by WISH using pro-insulin marker. Dorsal view, anterior to the left for 30 hpf embryos. Side view, anterior to the right for 4 dpf embryos. White arrow points to liver bud, White arrow head points to intestine. E. Liver formation in alr morphants monitored by hepatoblast marker prox1. In alr morphants, an obviously reduced liver size was observed at 48 hpf and 3 dpf. Although a discernible small liver was also observed in some embryos at 26 hpf, but quantification of embryo population failed to show a statistically significant difference comparing to controls. The number of embryos analyzed was shown on the bottom left of each panel while the percentage of embryos with small liver was labeled on the bottom right corner. White arrow points to liver, white star points to pancreas. All images are dorsal view, anterior to the left. F. Liver formation in alr morphants monitored using hepatocyte marker cp. In alr morphants, a reduced liver size was also observed at 48 dpf, 3 dpf and 5 dpf. White arrow point to liver. All images are dorsal view, anterior to the left. |
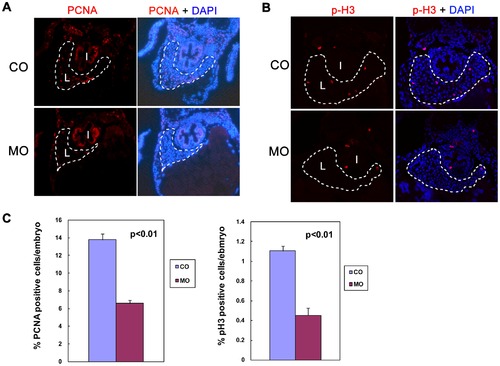
Knockdown of alr reduces hepatocyte proliferation. A & B. Hepatocyte proliferation demonstrated by immunofluorescent staining of proliferation markers in 4 dpf embryos: proliferating cell nuclear antigen (PCNA) (A) and phosphor-histone 3 (p-H3) (B). The sections were counterstained with DAPI to label nucleus. PCNA and p-H3 staining is co-localized with DAPI, indicative of nucleus staining. Both PCNA and p-H3 staining showed a significantly reduced hepatocyte proliferation in morphants without affecting proliferation in other tissues such as intestine. I: intestine; L: liver. Dash line circles the boundary of liver. C. Quantification of hepatocyte proliferation. Percentage of PCNA positive hepatocytes in liver is reduced from 13.8% in CO to 6.6% in MO. Percentage of p-H3 positive hepatocytes in liver is reduced from 1.1% in CO to 0.45% in MO. Values are means ± standard deviation (SD). Hepatocytes were counted based on cell morphology. PHENOTYPE:
|
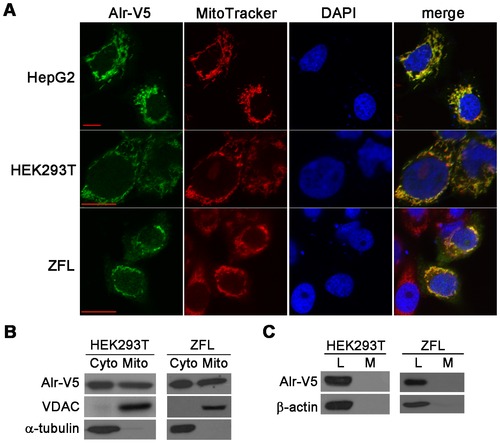
Zebrafish Alr is localized in both the cytosol and mitochondria, but neither in the nucleus nor secreted outside of the cell. A. Alr subcellular localization by immunofluorescent staining. Human hepatocellular carcinoma cells HepG2, human embryonic kidney cells HEK293T and zebrafish liver cells ZFL were transfected with pEF6/V5-His-TOPO plasmid expressing Alr-V5. MitoTracker was used to label the mitochondria and the cells were counter stained with DAPI to mark the nucleus. The Alr protein is co-localized with MitoTracker in the mitochondria, but not present in nucleus. Scale bar is 10 μm. B. Alr subcellular localization by cell fractionation. Western blot revealed that Alr was localized in both the cytosol and mitochondria fractions in transfected HEK293T cells and zebrafish liver cell line (ZFL). Alr was detected by anti-V5 antibody. The mitochondrial porin voltage-dependent anion channel (VDAC) was used as the mitochondria marker while α-tubulin was used as the cytosolic marker. C. Alr was not secreted outside of cell. Alr-V5 was detected in cell lysates but not in the conditioned medium in both HEK293T and ZFL cells. β-actin was used as loading control. L, cell lysate; M, medium. |
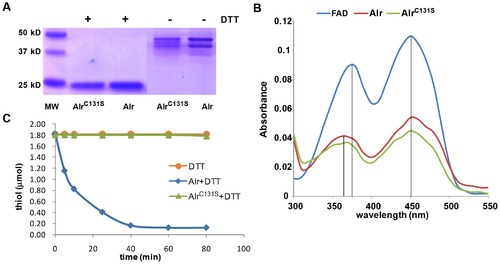
Zebrafish Alr is a flavin-linked sulfhydryl oxidase. A. Alr is present as dimers. Recombinant zebrafish Alr purified from E.coli was examined by SDS-PAGE and stained by commassie blue. In the presence of the reducing reagent DTT, Alr protein is in the monomer form, with a size of around 23 kD. In the absence of DTT, both Alr and the mutant AlrC131S are present as dimers with sizes in the 40~46 kD region. B. Absorption spectra of recombinant zebrafish Alr and AlrC131S protein at 15 µM. Free FAD at 15 µM was used as reference and its spectra show the typical riboflavin spectrum, with two absorbance peaks at around 375 nm and 450 nm. The absorption spectra of both the wild type Alr protein and mutant AlrC131S protein are characteristic of the FAD moiety, with a minor shift of the first peak to 365 nm compared to the free FAD. Under equal molar concentration, the amount of Alr-bound FAD is only half of the free FAD, indicating about 50% loading of FAD in the recombinant Alr preparation. C. Alr is a sulfhydryl oxidase. Enzymatic assay using DTT as substrate, showing the reduction of free thiol groups overtime. The blue line represents DTT alone. Wild type Alr protein oxidized thiol groups over time while the CxxC motif mutant, AlrC131S, completely lost the sulfhydryl oxidase activity. |
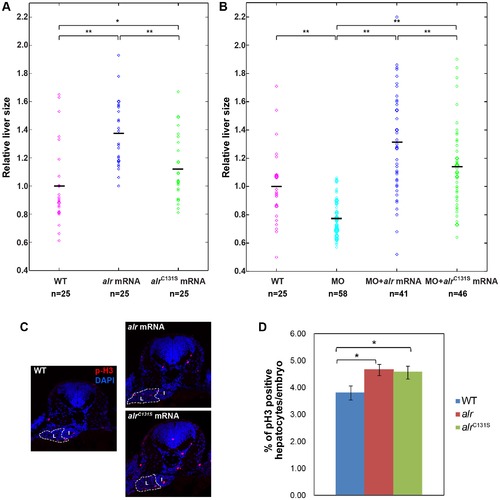
alr overexpression promotes liver growth and rescues alr morphants. A. Overexpression of both alr and enzyme-inactive mutant alrC131S can promote liver growth. But the wild type alr is more efficient than alrC131S mutant. The mean liver sizes (means ± SD) are: WT (1.00±0.28), alr mRNA (1.37±0.23) and alrC131S mRNA (1.13±0.23). B. Both alr and alrC131S overexpression can rescue alr morphant and restore liver size. The mean liver sizes (means ± SD) are: WT (1.00±0.25), MO (0.78±0.13), MO+alr mRNA (1.30±0.37) and MO+alrC131S mRNA (1.14±0.30). The black line in the middle of scattered dots indicates the mean liver size in that group. The brackets on top indicate the respective two samples compared by student′s t-test. n, number of embryo analyzed. *, p<0.05; **, p<0.01. C and D. Overexpression of alr and alrC131S promote liver growth by promoting hepatocyte proliferation. Hepatocyte proliferation demonstrated by immunofluorescent staining of proliferation marker p-H3 in 48 hpf embryos (red color). The tissue sections were counterstained with DAPI (blue) to label nucleus. I: intestine; L: liver. Dash line circles the boundary of liver. *, p<0.05. Sample number and other details are described in the relevant methods section. PHENOTYPE:
|
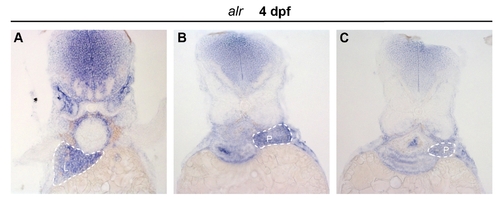
Expression of alr in zebrafish exocrine pancreas. Cross-sections of 4 dpf embryos after WISH with alr probe were presented. A, cross section of embryo at the position of liver, dash line circles the liver. B, cross section of embryo at the position of anterior pancreas, the pancreas is circled by dash line. Expression of alr is found in exocrine pancreas. C, cross section of embryo at the position of posterior pancreas, dash line circles the exocrine pancreas. L: liver; P: pancreas. EXPRESSION / LABELING:
|

Liver growth is significantly inhibited in alr morphants. Cryostat section was obtained from 5 dpf Tg(lfabp:DsRed; elaA:EGFP) embryos. Red color is from the DsRed expressed under lfabp promoter, indicating the liver. Blue color is the nucleus staining by DAPI. Images in the same column are sections from similar anterior-posterior position of liver. |
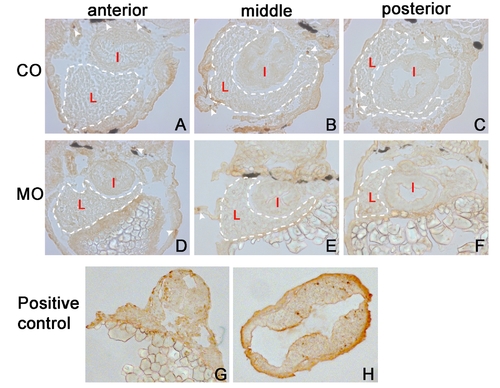
Hepatocyte apoptosis is not elevated in alr morphants. A–F, TUNEL assay performed on 4 dpf embryo liver sections. White dashed lines outline the liver. White arrowheads indicate some of the positively stained cells, which are undergoing apoptosis. Very low levels of apoptosis are found in the developing livers of wild type embryos and alr morphants. G, DNase treated sample from 30 hpf embryos, as a positive control. H, brain section from 30 hpf embryos, treated by heat shock (39 degree, 1 hour) to induce apoptosis, as a positive control. L: liver; I: intestine. (Yabu et al., 2001) Yabu, T., Todoriki, S., Yamashita, M., 2001. Stress-induced apoptosis by heat shock, UV and γ-ray irradiation in zebrafish embryos detected by increased caspase activity and whole-mount TUNEL staining. Fisheries Science 67, 333–340. |
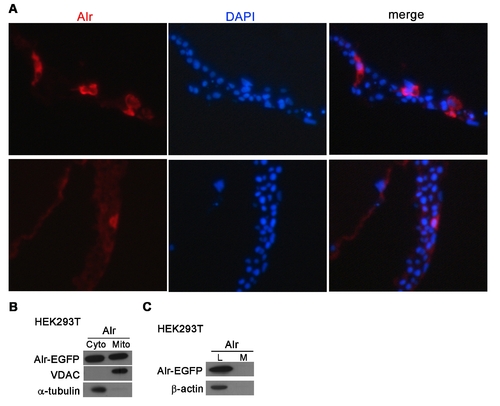
Cellular localization of Alr-EGFP in zebrafish embryo and cultured cells. A. Alr-EGFP is mainly localized in the cytoplasm in zebrafish embryo. The plasmid expressing Alr-EGFP fusion protein under the CMV promoter, was injected into zebrafish 1-cell stage embryos and these embryos were fixed at shield stages (6 hpf) and processed for sectioning. The cryo-sections were stained with mouse anti-GFP primary antibody and Alexa Fluor 568 conjugated anti-mouse IgG secondary antibody. DAPI was used to stain nucleus. Red color shows the predominant presence of Alr-EGFP fusion protein in cytoplasm, but not nucleus. B. Alr-EGFP is localized in both the cytosol and mitochondria. HEK293T cells were transfected with Alr-EGFP expressing plasmid. Cell fractionation followed by Western blot using anti-EGFP antibody revealed that Alr-EGFP was localized in both the cytosol and mitochondria in transfected HEK293T cells. The mitochondrial porin voltage-dependent anion channel (VDAC) was used as the mitochondria marker while α-tubulin was used as the cytosolic marker. C. Alr was not secreted outside of cell. Alr-EGFP is detected by anti-GFP antibody Western blot. The β-actin was used as loading control. L, cell lysate; M, conditioned medium. |