
Fig. 3
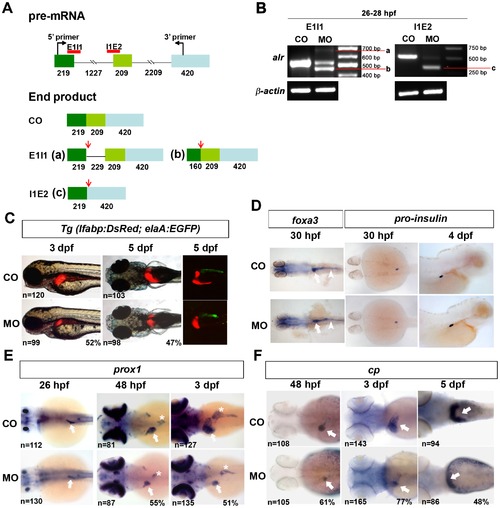
Knockdown of alr by antisense morpholino oligonucleotide inhibits liver growth. A. Schematic presentation of alr pre-mRNA and morpholino design. alr pre-mRNA consists of 3 exons (shown by squares) and 2 introns (shown by lines). The number of nucleotides in each region is labeled below the region. The red lines indicate the targeting sites of the two splicing inhibiting morpholinos, E1I1 and I1E2. In 5-bp mismatch control morpholino injected embryos (CO), splicing of alr pre-mRNA is not affected. In E1I1 morpholino injected embryos, two alternative splicing sites are used. One of the alternative splicing sites is at 229 bp downstream of the 52 boarder of intron 1, generating mRNA product a; the other alternative splicing site is in exon 1, 160 bp downstream of the 52 end of exon 1, producing the mRNA product b. In I1E2 morphants, E1I1 splicing site and I2E3 splicing site will join together and generate mRNA c (with exon 2 removed). The red arrows show the stop codons present in these alternatively spliced mRNAs. B. RT-PCR results demonstrate the potent knockdown of endogenous alr mRNA by the splicing morpholinos. Bands a, b and c are described in Fig. 3A. Morpholinos were injected at 5 ng per embryo, and total RNA was extracted from these embryos at 26–28 hpf. CO, 5-bp mismatch morpholino injected embryos; MO, morpholino injected embryos. β-actin was used as internal control for RT-PCR. C. Knockdown of alr suppressed liver growth in Tg(lfabp:DsRed;elaA:EGFP) embryos. Three morpholinos showed similar phenotype, and the photos shown are from translation blocking morpholino injected embryos. Liver size (red color) was reduced significantly in MO, compared to CO. In the right panel, confocal fluorescent images show suppressed liver (red) and exocrine pancreas (green). All images are anterior to the left, side view for 3 dpf embryos, dorsal view for 5 dpf embryos. D. Knockdown of alr did not affect intestine and endocrine pancreas formation. Intestine was marked by WISH using pan-endoderm marker foxa3. Endocrine pancreas was shown by WISH using pro-insulin marker. Dorsal view, anterior to the left for 30 hpf embryos. Side view, anterior to the right for 4 dpf embryos. White arrow points to liver bud, White arrow head points to intestine. E. Liver formation in alr morphants monitored by hepatoblast marker prox1. In alr morphants, an obviously reduced liver size was observed at 48 hpf and 3 dpf. Although a discernible small liver was also observed in some embryos at 26 hpf, but quantification of embryo population failed to show a statistically significant difference comparing to controls. The number of embryos analyzed was shown on the bottom left of each panel while the percentage of embryos with small liver was labeled on the bottom right corner. White arrow points to liver, white star points to pancreas. All images are dorsal view, anterior to the left. F. Liver formation in alr morphants monitored using hepatocyte marker cp. In alr morphants, a reduced liver size was also observed at 48 dpf, 3 dpf and 5 dpf. White arrow point to liver. All images are dorsal view, anterior to the left. |
| Genes: | |
|---|---|
| Fish: | |
| Knockdown Reagent: | |
| Anatomical Terms: | |
| Stage Range: | Prim-5 to Day 5 |
| Fish: | |
|---|---|
| Knockdown Reagent: | |
| Observed In: | |
| Stage Range: | Prim-5 to Day 5 |