
- Title
-
Nephronectin regulates atrioventricular canal differentiation via Bmp4-Has2 signaling in zebrafish
- Authors
- Patra, C., Diehl, F., Ferrazzi, F., van Amerongen, M.J., Novoyatleva, T., Schaefer, L., Mühlfeld, C., Jungblut, B., and Engel, F.B.
- Source
- Full text @ Development

npnt is transiently expressed during rat and zebrafish heart development. (A) Npnt expression levels in rat heart tissue from E11 to P10.5 in 12-hour intervals according to microarray analysis (Affymetrix GeneChip Rat Expression Set 230). Blue line, real profile; red line, smoothened profile. (B) RT-PCR analysis of Npnt mRNA expression during rat heart development. Gapdh was used as loading control. Ladder indicates a size marker. (C-L) Zebrafish npnt expression determined by whole-mount in situ hybridization. (C) Lateral view of a 24 hpf embryo showing npnt expression at tailbud (white arrowhead), head (black arrow) and posterior part of the gut (white arrow). (D) Dorsal view of the anterior part of the trunk demonstrating expression in pharyngeal endoderm (arrows). (E,F) Lateral (E) and dorsal (F) views at 34 hpf showing expression in the pronephric region (arrows) and head (arrowhead). (G,H) Ventrolateral view (G) and parasagittal section (H) at 44 hpf demonstrating npnt expression in heart (arrows) and jaw (arrowheads). (I,J) Paraffin section (4 μm) confirming expression in the myocardium (I, 200×; J, 1000×). (K) Dorsal view showing npnt expression at 53 hpf in pharynx, esophagus (arrow) and pharyngeal endoderm (arrowheads). (L) Transverse section through the trunk confirming expression in the endodermal cells of the anterior gut (arrow). A, atrium; EC, endocardium; MC, myocardium; V, ventricle. Scale bars: 100 μm in C-H,K,L; 50 μm in I; 20 μm in J. |
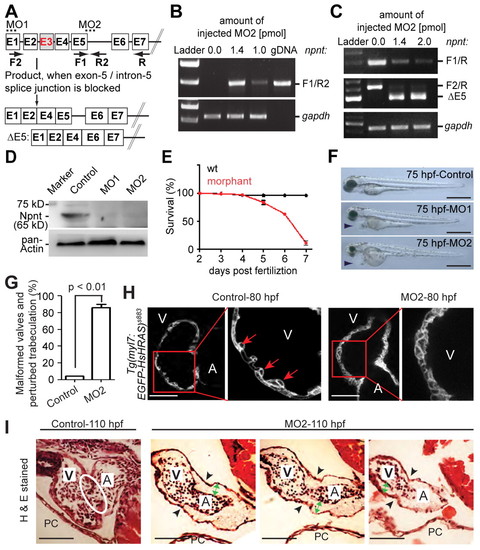
Npnt knockdown disrupts heart development and is lethal. (A) Scheme of the effect of npnt splice-inhibitory morpholino MO2. Exons are represented by boxes and introns by lines. Dotted lines indicate the region targeted by MO1 or MO2 and arrows indicate RT-PCR primer positions. Exon E3 could not be detected. (B,C) RT-PCR analysis of mRNAs from control and MO2-injected zebrafish embryos at 52 hpf using npnt primers as indicated in A and gapdh primers (loading control) (n=3). MO2 inhibited npnt pre-mRNA splicing, resulting in intron insertion (B) and exon E5 deletion (C). (D) Western blot analysis of control and MO1- or MO2-injected embryos at 52 hpf (n=3). Both morpholinos efficiently knocked down the Npnt protein level. (E) Npnt knockdown resulted in 89±7.9% (mean ± s.e.m.) lethality at 7 dpf. (F) Lateral view of control, MO1- or MO2-injected embryos at 75 hpf. MO1 or MO2 injection resulted in pericardial edema (arrowheads). (G) Quantitative analysis. Valve formation and trabeculation are perturbed in 86±3.9% (mean ± s.e.m.) of morphant hearts at 110 hpf. (H) Confocal images of hearts from control and MO2-injected embryos from transgenic Tg(myl7:EGFP-HsHRAS)s883 zebrafish at 80 hpf suggesting that the initiation of trabeculation is perturbed in npnt morphants. Red arrows indicate trabeculae. (I) Hematoxylin and Eosin (H&E)-stained sagittal sections of hearts from control and MO2-injected embryos at 110 hpf. In contrast to morphants, control embryos develop proper atrioventricular (AV) valve leaflets (white oval). Black arrowheads indicate the AV boundary; green arrows indicate expanded cardiac jelly. A, atrium; V, ventricle; PC, pericardium. Scale bars: 500 μm in F; 50 μm in H,I. EXPRESSION / LABELING:
PHENOTYPE:
|

Npnt knockdown causes extension of the AV canal. (A-D) Projections of confocal images of hearts from control (A,C) and MO2-injected (B,D) embryos from transgenic Tg(myl7:EGFP-HsHRAS)s883 (A,B) and Tg(–5.1myl7:nDsRed2)f2 (C,D) zebrafish at 52 hpf, suggesting an extension of the AV canal (brackets) in npnt morphants. (E) Representative images of hearts from control, MO2-injected and MO2 + npnt mRNA-injected embryos from transgenic Tg(myl7:EGFP-HsHRAS)s883 zebrafish at 52 hpf. Brackets indicate the AV boundary. (F) Quantitative analysis (n>160 from three independent experiments; mean ± s.e.m.). Note that injection of npnt mRNA rescued the MO2-mediated AV canal extension. (G) Quantitative analysis scoring of type I (mild extension of the AV canal), type II (obvious extension of the AV canal) and type III (straight heart) AV canal defects (mean ± s.e.m.). A, atrium; V, ventricle. Scale bars: 50 μm. |

Characterization of the extended AV canal. (A,B) Confocal sections of whole-mount Alcam-stained (red, indicating myocardium and differentiated endocardial cells) control (A) and MO2-injected (B) embryos from transgenic Tg(kdrl:EGFP)s843 zebrafish at 52 hpf. Npnt depletion caused an increase in differentiated endocardial cells (cuboidal in shape, Alcam positive and EGFP positive) at the AV boundary. Arrowheads indicate the AV boundary; red line, myocardium; green, endocardial cells; black dots, Alcam-positive endocardial cells. (C) Quantitative analysis of Alcam-positive endocardial cells (mean ± s.e.m.). SAV, superior AV; IAV, inferior AV. (D-G) Sections of 52 hpf control and MO2-injected embryos after whole-mount in situ hybridization for notch1b (D), cspg2 (E), fibulin 1 (F) and bmp4 (G). Expression of these genes was expanded in npnt morphants (brackets). (H) In situ hybridization with probes against the chamber-specific marker genes amhc and vmhc. (I) Projections of confocal images of hearts from whole-mount control and MO2-injected embryos from double-transgenic [Tg(–5.1myl7:nDsRed2)f2 × Tg(myl7:EGFP-HsHRAS)s883] zebrafish stained for atrial myosin heavy chain (MHC, white) and DsRed (red). Yellow line, AV junction. (J) Quantitative analysis of total (chambers + AV boundary) and atrial cardiomyocyte number (mean ± s.e.m.). ns, not significant. A, atrium; V, ventricle. Scale bars: 50 μm. |

Npnt knockdown causes cardiac jelly expansion and expanded expression of has2 and tbx2b. (A,B) Confocal sections from whole-mount F-actin-stained (red) control (A) and MO2-injected (B) Tg(kdrl:EGFP)s843 zebrafish embryos at 52 hpf. The space between endocardium and myocardium was increased at the AV boundary (arrowheads) and throughout the chambers (red asterisks) in npnt morphants. (C-F) Sections of 52 hpf control and MO2-injected embryos after whole-mount in situ hybridization for has2 and tbx2b expression (brackets). Note that the expression of these genes is expanded in npnt morphants. (G-J) Sections (4 μm) of control, MO2-, has2 MO-, or has2 MO + MO2-injected zebrafish embryos at 52 hpf stained for hyaluronan (brown) and counterstained with Hematoxylin (blue). (K-N) Transmission electron microscopy of hearts (K,L) and endocardial cells (M,N) from control and MO2-injected embryos at 52 hpf. Arrowheads indicate junctional complexes. A, atrium; BC, blood cell; CJ, cardiac jelly; EC, endocardium; MC, myocardium; V, ventricle. Scale bars: 50 μm in A-F; 10 μm in G-J; 5 μm in K,L; 1 μm in M,N. |
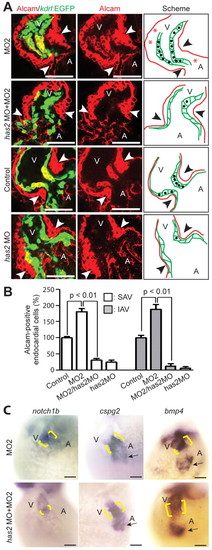
Has2 knockdown rescues the endocardial phenotype in npnt morphants. (A) Confocal sections and schematics of whole-mount Alcam-stained (red, indicating myocardium and differentiated endocardial cells) MO2-injected, has2 MO + MO2-injected, control-injected and has2 MO-injected embryos from transgenic Tg(kdrl:EGFP)s843 zebrafish at 52 hpf. Red line, myocardium; green, endocardial cells; black dots, Alcam-positive endocardial cells. Npnt depletion caused an increase in differentiated AV endocardial cells (cuboidal in shape, Alcam positive and EGFP positive) (number of tiers e8, SAV; number of tiers e5, IAV). Knockdown of Has2 in npnt morphants or wild-type embryos reduced the number of tiers to two or fewer in SAV or IAV. Arrowheads indicate the AV boundary. (B) Quantitative analysis. Has2 knockdown in npnt morphants rescued the AV canal endocardium extension (mean ± s.e.m.). SAV, superior AV; IAV, inferior AV. (C) Bright-field images of 52 hpf MO2-injected and has2 MO + MO2-injected embryos after whole-mount in situ hybridization for notch1b, cspg2 and bmp4 expression (brackets). Note that Has2 knockdown reduced the expanded expression of notch1b but not of cspg2 or bmp4 in npnt morphants (arrows). A, atrium; V, ventricle. Scale bars: 50 μm. |
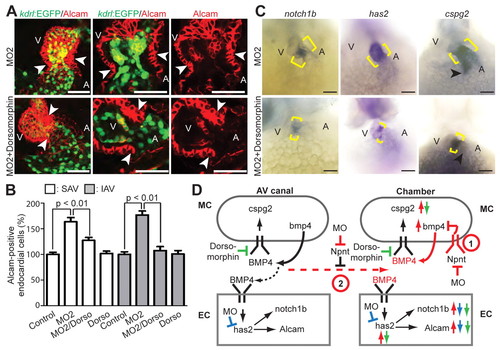
Inhibition of BMP signaling reduces AV canal expansion. (A) Projections of confocal images and confocal sections of hearts of MO2-injected Tg(kdrl:EGFP)s843 zebrafish embryos at 52 hpf with and without dorsomorphin treatment stained for Alcam (red, indicating myocardium and differentiated endocardial cells). (B) Quantitative analysis. Inhibition of BMP signaling by dorsomorphin (Dorso) in the npnt morphants rescued the AV canal endocardium extension (mean ± s.e.m.). SAV, superior AV; IAV, inferior AV. (C) Bright-field images of 52 hpf untreated and dorsomorphin-treated npnt morphants after whole-mount in situ hybridization for notch1b, cspg2 and has2 expression. Dorsomorphin treatment reduced the expression of notch1b and has2 at the AV boundary in npnt morphants (brackets). Moreover, ectopic expression of cspg2 at the inflow tract in npnt morphants is abolished (arrowheads) and cspg2 expression at the AV boundary is partially rescued. (D) Model of the regulatory role of Npnt. 1 and 2 are two possible mechanisms of how Npnt affects Bmp4 signaling. (1) Npnt activates a receptor that is expressed in the chamber myocardium to repress Bmp4 signaling. (2) Npnt inhibits diffusion of Bmp4, resulting in autocrine signaling. Arrows indicate changes after Npnt depletion in wild type (red) or upon has2 depletion (blue) or dorsomorphin treatment (green) in npnt morphants. Red dashed arrow indicates Bmp4 diffusion in the npnt morphant. Black dashed arrow indicates controlled Bmp4 diffusion in the wild type. A, atrium; V, ventricle; EC, endocardium; MC, myocardium; MO, morpholino. Scale bars: 50 μm. EXPRESSION / LABELING:
|
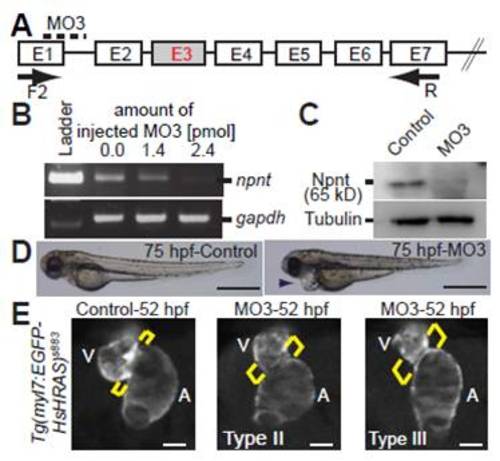
Characterization of splice-inhibitory morpholino MO3-mediated Npnt knockdown. (A) Scheme of the splice-inhibitory effect of MO3. npnt exon E3 could not be detected by RT-PCR. (B) RT-PCR analysis of mRNAs from control and MO3-injected embryos at 52 hpf. (C) Western blot analysis of protein extracts from control and MO3-injected embryos at 52 hpf. (D) Lateral view of control and MO3-injected embryos at 75 hpf. MO3 injection resulted in pericardial edema (arrowhead). (E) MO3-injected embryos from transgenic Tg(myl7:EGFP-HsHRAS)s883 zebrafish showed an expansion of the AV canal at 52 hpf. Brackets indicate the AV boundary. A, atrium; V, ventricle. Scale bars: 500 μm in D; 50 μm in E. PHENOTYPE:
|

Classification of AV canal defects. (A) Nomarski images at 52 hpf representing AV canal extension defects. Depending on severity, phenotypes were classified as type I (mild extension of the AV canal), type II (obvious extension of the AV canal) and type III (straight heart). Brackets indicate the AV boundary. Scale bars: 50 μm. (B) Quantitative analysis of embryos in terms of AV canal extension in total (n>150 from three independent experiments; mean ± s.e.m.). (C) Quantitative analysis in terms of type I, type II and type III AV canal extension. Note that type II was the most common phenotype (over 50%) in both MO1- and MO2-injected embryos. |

Npnt variant analysis. (A) Scheme of the splicing events from genomic DNA (gDNA) resulting in the two described variants (NCBI, Patra). Exons are represented by boxes and introns by lines. (B) RT-PCR analysis of mRNAs derived from embryos at different developmental stages and from adult tail fins using the npnt primers indicated A and gapdh primers (loading control) (n=3). (C,D) Comparison of the two variants at the protein level by sequence alignment (C) and Motif Scan analysis (D). |
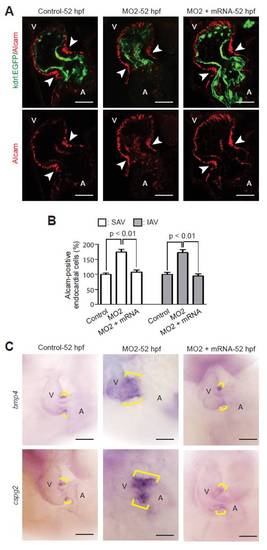
npnt mRNA rescues the MO2 phenotype on a cellular and molecular level. (A) Confocal sections of whole-mount Alcam-stained (red: myocardium and differentiated endocardial cells) control, MO2-injected and MO2 + npnt mRNA-injected embryos from transgenic Tg(kdrl:EGFP)s843 zebrafish at 52 hpf. Note that injection of npnt mRNA rescued the MO2-mediated increase in Alcam-positive endocardial cells. Arrowheads indicate the AV boundary. (B) Quantitative analysis. MO2 + npnt mRNA-injected embryos were analyzed from morphologically rescued embryos. Mean ± s.e.m. (C) Representative images of hearts from control, MO2-injected and MO2 + npnt mRNA-injected embryos after whole-mount in situ hybridization with probes against bmp4 and cspg2 at 52 hpf. Note that injection of npnt mRNA rescued the MO2-mediated expansion of these genes. Brackets indicate the AV boundary. SAV, superior AV; IAV, inferior AV; A, atrium; V, ventricle. Scale bars: 50 μm. |
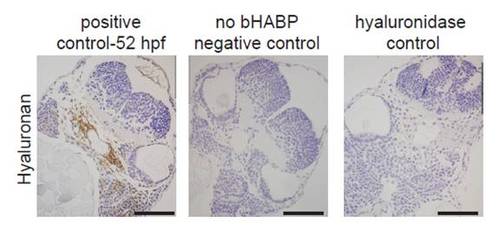
Establishment of hyaluronan staining. Paraffin-sections (4 µm) of zebrafish embryos at 52 hpf stained for hyaluronan (brown) and counterstained with Hematoxylin (blue). Note that absence of biotinylated HA-binding protein (bHABP) or hyaluronidase treatment resulted in no staining, demonstrating the specificity of HA staining. Scale bars: 50 μm. |
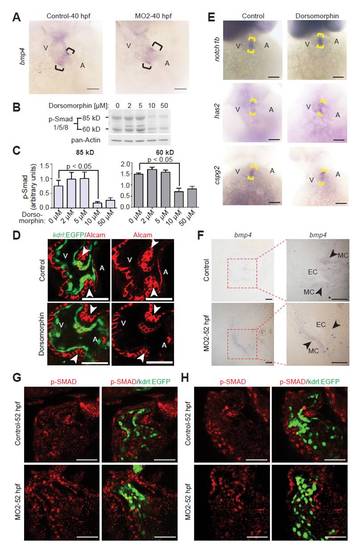
Inhibition of BMP signaling. (A) Representative images of hearts from control and MO2-injected embryos after whole-mount in situ hybridization with probes against bmp4 at 40 hpf. Note that bmp4 expression is restricted in npnt morphants at 40 hpf. Brackets indicate the AV boundary. A, atrium; V, ventricle. (B) Western blot analysis of Smad1/5/8 phosphorylation using protein extracts from 48 hpf embryos treated with dorsomorphin at 25 hpf. (C) Quantitative analysis of western blot analyses in B (mean ± s.e.m., n=4). (D) Confocal sections of whole-mount Alcam-stained (red) control and 10 μM dorsomorphin-treated embryos from transgenic zebrafish Tg(kdrl:EGFP)s843 at 52 hpf. The number of differentiated endocardial cells (cuboidal in shape, Alcam-positive and EGFP-positive) remained unchanged in dorsomorphin-treated animals. Arrowheads indicate the AV boundary. SAV, superior AV; IAV, inferior AV. (E) Bright-field images of 52 hpf control and 10 μM dorsomorphin-treated embryos after whole-mount in situ hybridization with probes against notch1b, has2 and cspg2. Expression of these genes remained unaffected in dorsomorphin-treated embryos. (F) Sections (2 μm) of the heart from control and MO2-injected embryos after whole-mount bmp4 in situ hybridization at 52 hpf. EC, endocardium; MC, myocardium. (G,H) Confocal sections of whole-mount p-Smad1/5/8-stained (red) control and MO2-injected embryos from transgenic Tg(kdrl:EGFP)s843 zebrafish at 52 hpf. Note that p-Smad1/5/8 staining in control hearts is weaker in the AV endocardium (green) compared with the myocardium. By contrast, in npnt morphants the p-Smad1/5/8 staining is of similar intensity in the expanded AV endocardium and myocardium. Scale bars: 50 μm in A,D,E,G,H; 20 μm in F. |
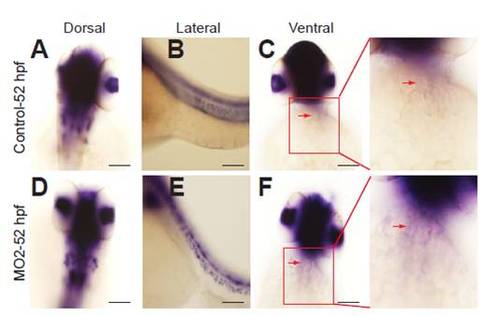
Npnt knockdown does not result in ectopic activation of Wnt/β-catenin signaling at 52 hpf in the heart. (A-F) Activation of Wnt/β-catenin signaling was determined by whole-mount in situ hybridization against GFP on control and MO2-injected embryos from the reporter line Tg(TOP:GFP)w25, where activation of Wnt/β-catenin signaling results in GFP expression. Dorsal (A,D), lateral (B,E) and ventral (C,F) views show activation of Wnt/β-catenin signaling in the head, trunk, eye lens and jaw for both the control and MO2-injected embryos. Note that expression of GFP could not be detected in the heart (arrows). Scale bars: 50 μm. |
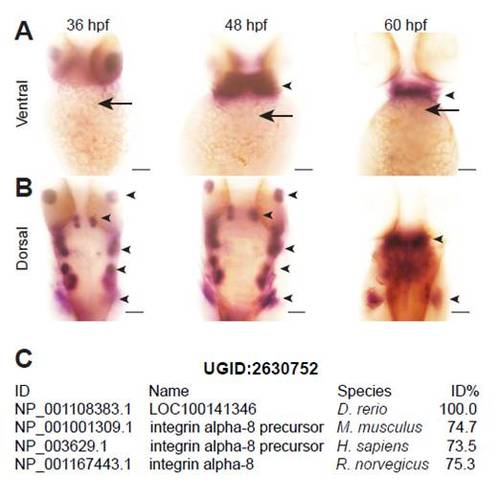
itga8 is not expressed during early heart development. (A,B) Ventral (A) and dorsal (B) views of 36 hpf, 48 hpf and 60 hpf embryos after in situ hybridization. Expression of itga8 could not be detected in the heart (arrows), but was in several other tissues (arrowheads). Scale bars: 50 μm. (C) UniGene Cluster UGID:2630752 demonstrating the homology of the zebrafish protein LOC10014136 encoded by zgc:172265 (NM_001114911.1) to integrin α8 of other species. |