
- Title
-
The nucleolar GTP-binding proteins Gnl2 and nucleostemin are required for retinal neurogenesis in developing zebrafish
- Authors
- Paridaen, J.T., Janson, E., Utami, K.H., Pereboom, T.C., Essers, P.B., van Rooijen, C., Zivkovic, D., and Macinnes, A.W.
- Source
- Full text @ Dev. Biol.

Identification of a loss of function mutation in zebrafish gnl2. (A–F) Expression of the proneural bHLH transcription factor ascl1a is subtly expanded in the bw41c mutant (B) diencephalon (arrow) and hindbrain (arrowhead) at 24 hpf. At 30 hpf, the ascl1a-expressing domain is expanded in the bw41c mutant hindbrain (arrowhead in D). At 42 hpf, ascl1a expression is expanded in the midbrain (arrow), dorsal diencephalon and hindbrain (arrowhead) of bw41c mutants (F). (G and H) At 36 hpf, neuronal clusters were expanded in the bw41c mutant brain as demonstrated by the terminally differentiated neuronal marker HuC/D. (I–L) bw41c mutant phenotype at 24 (J) and 48 hpf (L). The earliest clearly visible defects in bw41c mutants (J) are the reduced forebrain (arrow), smaller eyes, thinner mid/hindbrain boundary (dashed line and arrowhead) and hyperinflated hindbrain ventricle. At 48 hpf, bw41c mutants (L) are characterized by smaller eyes, thinner mid/hindbrain boundary (dashed line and arrowhead) and severe hyperinflation of the hindbrain ventricle. (M) Schematic drawing of the Gnl2 protein with the bw41c mutation indicated by the dashed red line. (N) Phylogenetic tree of the five members of the Gnl family, Lsg-1, Gnl1, Gnl2, Gnl3/NS and Gnl3l in Drosophila melanogaster (dm), Danio rerio (dr), Mus musculus (mm) and Homo sapiens (hs). Lsg1 and Gnl1 on one hand, and Gnl2, Gnl3/NS and Gnl3l on the other hand appear to have separate common ancestors. In Drosophila and other invertebrates, there are no separate orthologs of Gnl3/NS and Gnl3l, but one common ortholog that is more similar to NS than to Gnl3l. All images are lateral view, with anterior to the left and dorsal up. di, diencephalon; e, eye; h, hindbrain; hv, hindbrain ventricle; ot, optic tectum; tg, tegmentum; t, telencephalon. Scalebar 125 μm. |
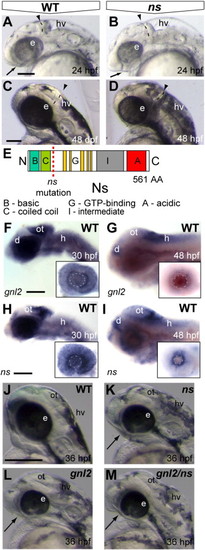
A loss of function mutation in zebrafish ns indicates redundancy between Gnl2 and NS. (A–D) The earliest visible defects that emerge around 24 hpf (A and B) in ns mutants (B) are the reduced forebrain (arrow), reduced eye size, thinner mid/hindbrain boundary (dashed line and arrowhead) and hyperinflated hindbrain ventricle. At 48 hpf, ns mutants (D) are characterized by smaller eyes, thinner mid/hindbrain boundary (dashed line and arrowhead) and severe hyperinflation of the hindbrain ventricle. (E) Schematic drawing of the NS protein with the position of the nshu3259 mutation indicated by the red dashed line. (F and G) gnl2 transcript is expressed throughout the brain at 30 hpf (F), with higher expression levels in the dorsal diencephalon, optic tectum, hindbrain and retina (inset in F). At 48 hpf (G), gnl2 transcript is expressed in the proliferative areas of the brain, namely the dorsal diencephalon, posterior optic tectum and hindbrain. In the retina, gnl2 expression is restricted to the proliferative ciliary marginal zone at 48 hpf (inset in G). ns transcript is expressed throughout the brain at 30 hpf (H), with higher expression levels in the dorsal diencephalon, optic tectum, hindbrain and retina (inset in H). At 48 hpf, ns transcripts are expressed in the dorsal diencephalon, posterior optic tectum and hindbrain (I). In the retina, ns is expressed in the ciliary marginal zone (inset in I). (J–M) The morphology of WT (J), single ns (K), single gnl2 (L) and gnl2/ns compound mutants (M) shows synergistic worsening of the mutant phenotypes, such as reduction of the telencephalon (arrows) and eye size, upon combined depletion of gnl2 and ns. All images are lateral view, with anterior to the left and dorsal up. d, dorsal diencephalon; e, eye; h, hindbrain; hv, hindbrain ventricle; ot, optic tectum. Scalebar 125 μm. |
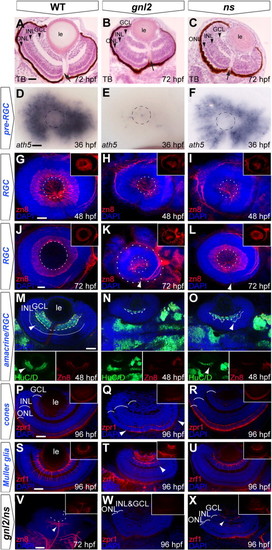
Delayed RGC differentiation in the gnl2 and ns mutant retina. (A–C) Transverse toluidine-blue stained sections of WT (A), gnl2 (B) and ns (C) showing incomplete formation of GCL, INL and ONL at 72 hpf (arrowheads). Arrow indicates optic nerve head. (D–F) Expression of ath5 marks retinal progenitors prior to cell cycle exit. At 36 hpf, ath5 is absent apart from a few cells in gnl2 mutants (E; n = 7 embryos), whereas its expression is reduced, but is normally patterned in ns mutants (F; n = 6). Dashed circle indicates the outline of the lens. (G–L) Confocal images of immunolabelings to the RGC marker zn8 (red) with DAPI nuclear counterstaining (blue) at 48 (G–I) and 72 (J–L) hpf. In gnl2 mutants, the GCL is disorganized and reduced in width at both 48 hpf (H; n = 11) and 72 hpf (K; n = 25). In ns mutants, formation of the GCL layer is incomplete at 48 hpf (I; n = 22), but has markedly improved at 72 hpf (L; n = 19). Insets show single zn8 fluorescence views. Dashed circles indicate the outline of the lens; the additional outer circle in (K) delineates the outline of the eye. (M–O) Single confocal planes of Hu/D (green) and zn8 (red) labeling with DAPI nuclear counterstaining (blue), which labels RGCs and differentiated amacrine cells, and RGCs only, respectively, in gnl2 (N; n = 5) and ns mutants (O; n = 6) at 48 hpf. Arrowhead shows amacrine cells that are labeled with HuC/D, but not with zn8. Dashed line shows boundary of GCL, dotted line marks boundary of amacrine cells in the INL. Insets show single HuC/D and zn8 fluorescence views. (P–R) At 96 hpf, differentiated photoreceptor cells marked by zpr1 staining in red with DAPI nuclear counterstaining (blue) are present in the central gnl2 mutant retina only (boundaries indicated with arrowheads in Q; n = 8). In ns mutants, photoreceptor cells have differentiated and are present throughout the outer nuclear layer (R; n = 5). Insets show single zpr1 fluorescence views. (S–U) At 96 hpf, Müller glial cells, marked by zrf1 staining in red with DAPI nuclear counterstaining (blue), have developed relatively normally in ns mutants (U; n = 11), but are disorganized and reduced in gnl2 mutants (arrowhead in T; n = 9). Insets show single zrf1 fluorescence views. (V–X) Differentiation of retinal cell types, such as RGCs (n = 5; V; compare to J), photoreceptor cells (n = 4; W, compare to P) and Müller glial cells (n = 3; X, compare to S) is severely affected in gnl2/ns compound mutants as compared to WTs. Inset show single fluorescence view. (A–C) Lateral up, anterior to the left. (D–L) Lateral view, anterior to the left and dorsal up. (M–X) Dorsal view, with anterior to the left. GCL, ganglion cell layer; INL, inner nuclear layer; le, lens; ONL, outer nuclear layer. Scalebar 25 μm. |
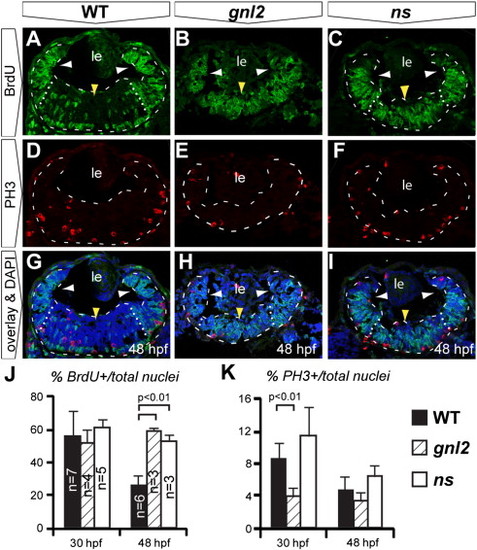
Upon Gnl2 and NS loss of function, retinal progenitors fail to exit the cell cycle in a timely manner. (A–J). Confocal images of BrdU (green) and PH3 (red) double immunolabelling with DAPI overlay (blue) in WT (A, D and G), gnl2 (B, E, H) and ns (C, F and I) embryos at 48 hpf. Retinae are outlined with dashed lines and subdivided into the peripheral (white arrowheads) and central retinae (yellow arrowhead) by dotted lines. In gnl2 (B) and ns (C) embryos at 48 hpf, many BrdU+ cells are present throughout the central retina (yellow arrowheads), whereas in the WT, BrdU+ cells are mainly found at the retinal margin (white arrowheads). The number of PH3+ cells is slightly decreased in gnl2 mutants (E), but not in ns mutants (F). (J) Quantification of the percentage of BrdU+ cells over the total cell number shows that there is no difference at 30 hpf. At 48 hpf, significantly more retinal cells are undergoing S-phase in gnl2 and ns mutants. (K) Quantification of the percentage of PH3+ cells over total cell number shows a reduction in cells undergoing M-phase in gnl2, but not in ns mutants. Lateral is up, anterior to the left. Statistics: Student′s t-test. p-values and experimental numbers indicated in graph. Error bars represent SD. Scalebar 25 μm. PHENOTYPE:
|
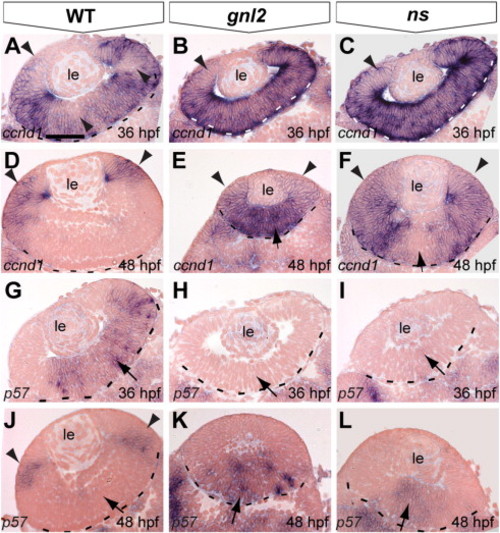
Aberrant expression of cell cycle regulators in gnl2 and ns mutant retinae. (A–F) Transverse sections showing expression of ccnd1 at 36 hpf (A–C) and 48 hpf (D–F). In the WT retina, a subset of cells has downregulated ccnd1 (arrowheads in A), indicating their withdrawal from the cell cycle. At 48 hpf, ccnd1 is restricted to the ciliary marginal zone that remains proliferative (arrowheads in D). In contrast, ccnd1 is not downregulated in gnl2 (n = 10; B) or ns (n = 10; C) mutant retinae at 36 hpf (arrowheads) and remains expressed in the central retina of gnl2 mutants (n = 9; arrow in E). In ns mutants, ccnd1 expression is downregulated in the central retina (n = 9; arrow in F), but remains expressed in the remainder of the retina (arrowheads). (G–L) Sections showing expression of p57kip2 in the WT central retina at 36 hpf (arrow in G). In contrast, there is no expression in gnl2 (n = 11; H) and ns (n = 9; I) mutant retinae (arrows). At 48 hpf, p57kip2 expression is restricted to the lateral surface of the retina in WTs (arrowheads in J). In contrast, p57kip2 is expressed in the central retina of gnl2, (n = 12; arrow in K) and ns mutants (n = 13; arrows in L). Dashed lines indicate outline of the retina. Dorsal view, anterior to the left. le, lens. Scalebar 25 μm. |
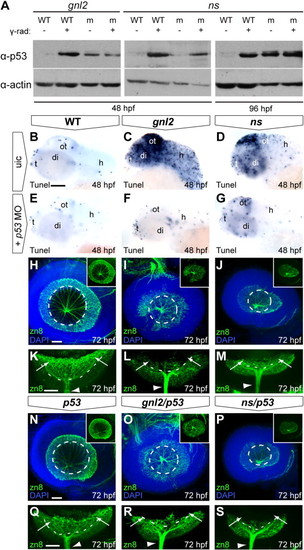
p53 stabilization upon loss of Gnl2 and NS causes apoptosis and differentially affects retinal differentiation. (A) Western blot analysis of p53 (top panel) shows stabilization of p53 protein in gnl2 and ns mutants at 48 hpf (left and middle panel) and ns mutants at 96 hpf (right panel) in comparison to low levels of p53 protein in WT embryos. As a control, stabilization of p53 upon exposure to 25 Gy of γ-irradiation is shown. Irradiation of gnl2 and ns mutants does not visibly increase p53 levels. The loading control for actin is shown in the bottom panel. (B–G) Tunel assay showing presence of apoptotic cells in gnl2 (C; n = 6) and ns mutants (D; n = 6) at 48 hpf with the highest incidence in the optic tectum. In ns mutants, apoptosis was less pronounced as compared to gnl2 mutants. (E–G) Upon injection of 1 ng of p53 MO, apoptosis is dramatically reduced in gnl2 (F; n = 13) and ns mutants (G; n = 16). Injection of p53 MO has no effect on cell survival in WT embryos (E; n = 57). (H–S) Confocal views of immunolabeling with zn8 antibody (green) that marks mature RGCs, with DAPI nuclear counterstaining (blue). (K–M) and (Q–S) show single zn8 fluorescence. Dashed lines indicate the outline of the lens. At 72 hpf, the GCL in WT (H and K) and single p53 mutants (n = 4; N and Q) has extended around the lens in a cup-like shape (arrows in K and Q). In contrast, gnl2 (n = 5; I and L) and ns (n = 5; J and M) mutants lack a fully formed GCL (arrows in L and M) and RGCs are present only in the central retina. In gnl2/p53 compound mutants (n = 3; O and R), differentiated RGCs were present only in the central retina and failed to extend around the lens (arrows in R) similar to single gnl2 mutants (arrows in L). The optic nerve size was equivalent between single gnl2 and compound gnl2/p53 mutants (arrowheads in L and R). Similarly, the GCL in ns/p53 compound mutants (n = 5; P and S) fails to extend around the lens properly (arrows in S) and the diameter of the optic nerve is similar to that of single ns mutants (arrowheads in M and S). (B–J and N–P) Lateral view, anterior to the left, dorsal up. (K–M and Q–S) Dorsal view, anterior to the left. di, diencephalon; h, hindbrain; ot, optic tectum; t, telencephalon; uic, uninjected control. Scalebar (B–G) 125 μm, (H–P) 25 μm. EXPRESSION / LABELING:
PHENOTYPE:
|
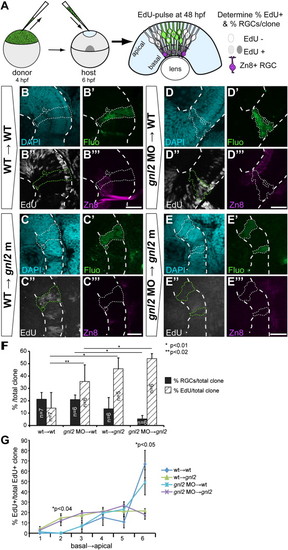
Gnl2 acts non-cell autonomously in retinal cell cycle exit and differentiation. (A) Experimental setup. Cells are taken from sphere-stage donor embryos that have been injected with fluorescein-dextran and biotin-dextran and are subsequently transplanted into the prospective eye field of shield-stage unlabelled host embryos. Embryos were exposed to a 30-minute EdU pulse at 48 hpf and were fixed immediately. Clones were examined for the proportion of EdU+ proliferating cells and zn8+ RGCs. (B–E) Single-plane confocal images of clones of transplanted cells showing DAPI-counterstained nuclei (cyan, top left), streptavidin-Alexa488 (green, top right), EdU (white, bottom left) and zn8-stained RGCs (magenta, bottom right). Clones of transplanted cells are outlined by dotted lines (white or green). The retina is outlined with dashed white lines. Shown are clones transplanted from WT donor to WT host (B), WT donor to gnl2 mutant host (C), 2 ng gnl2 MO-injected donor to WT host (D) and 2 ng gnl2 MO-injected donor to 2 ng gnl2 MO-injected host (E). (F) Quantification of the percentage of EdU+ (black bars) and zn8+ RGCs (striped bars) within transplanted clones for each of the experimental groups. Statistics: Two-tailed Student′s t-test, p-values indicated above the bars (*p < 0.01, **p < 0.02). Error bars represent the standard deviation. (G) Distribution of EdU+ cells within the clones of transplanted cells. The clones were divided along their baso-apical axis in 6 equidistant bins and the percentage of EdU+ cells/bin was determined. Clones from WT→WT and WT→gnl2 mutant, and gnl2→WT and gnl2→gnl2 show similar distribution of EdU+ cells along the apico-basal axis. In contrast, the distribution at bins 2 and 6 is significantly different between WT→WT and WT→gnl2 mutant, and gnl2→WT and gnl2→gnl2 clones. Statistics: Two-tailed Student′s t-test. Error bars represent SEM. Scalebar 25 μm. |
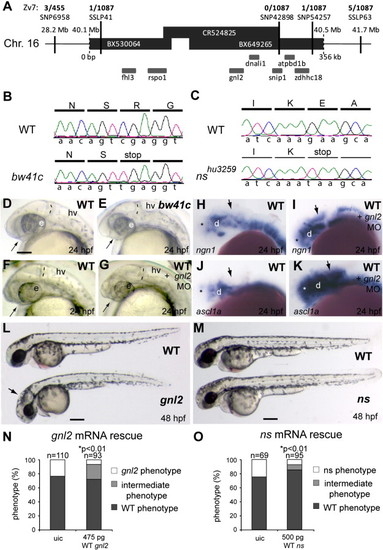
Characterization of gnl2 and ns mutants. (A and B) Positional cloning of the bw41c mutation by mapping of 1087 mutant embryos. Shown is the genomic candidate region, consisting of 3 overlapping bacterial artificial chromosomes (BACs; black bars) that cover about 350 kb (indicated below the bars) of chromosome 16. The position of this region on the chromosome is indicated above the bars. The SNPs and SSLPs used to position the mutation to this region and the numbers of recombinant mutant embryos for these polymorphic markers are indicated above the candidate region. Within the candidate region that is limited by SSLP41 on the left and SNP54257 on the right are 7 genes that are schematically drawn underneath the bars. (B) Sequencing of the bw41c candidate genes revealed the presence of a premature stop codon mutation (cga′tga) at position R53 in exon 3 of guanine nucleotide binding protein-like 2 (gnl2). (C) Using TILLING, a nonsense mutation resulting in a premature stop codon (gaa′taa) at position E117 in exon 5 of guanine nucleotide binding protein-like 3 (gnl3)/nucleostemin (ns) was identified in mutant nshu3259. (D and E) The bw41c mutant (E) phenotype at 24 hpf consists of reduced forebrain (arrow), slightly smaller eyes, thinner mid/hindbrain boundary (MHB; dashed lines) and a slightly hyperinflated hindbrain ventricle. (F–K) Injection of gnl2 translation-blocking morpholino (MO) phenocopies the bw41c mutant phenotype at 24 hpf (F; n = 40) as it causes reduction of the forebrain (arrow) and MHB (dashed line) in combination with a slight reduction of eye size. In addition, injection of gnl2 MO results in expanded expression domains (arrows) of the proneural genes ngn2 (I) and ascl1a (K). (L) WT (top) and bw41c/gnl2 mutant (bottom) embryos at 48 hpf, showing the reduced size of the bw41c/gnl2 embryo, its curved body axis, smaller eye and hyperinflated hindbrain ventricle (arrow). (M) WT (top) and ns mutant (bottom) embryos at 48 hpf, showing the reduced size of the ns head and eyes. (N) Injection of 475 pg WT gnl2 mRNA into progeny of heterozygous carriers results in partial rescue of the mutant morphology in gnl2-/- embryos, characterized by increased size of the total embryo, head and eyes. Number of embryos injected indicated above the bars. (O) Injection of 500 pg WT ns mRNA results in partial rescue of the nshu3295 phenotype. The partial rescue consisted of the increased size of the total embryo, head and eyes. The number of embryos injected is indicated above the bars. Statistics: two-tailed Fisher′s exact probability test for a table of frequency data with p-values indicated above the bar. All images lateral view, anterior to the left and dorsal up. e, eye; hv, hindbrain ventricle; MO, morpholino; uic, uninjected control. Scalebar (C–K) 125 μm, (L, M) 250 μm. |
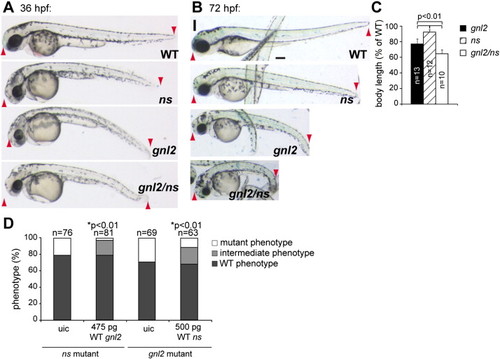
Gnl2 and NS have (partially) redundant functions. Phenotypes of WT, ns, gnl2 and gnl2/ns compound mutants at 36 (A) and 72 (B) hpf. At 36 hpf, gnl2/ns compound mutants (bottom panel in A) show enhanced reduction of the brain, eye and whole body length (red arrowheads in A) and enhanced hyperinflation of the hindbrain ventricle as compared to the single gnl2 and ns mutants. (B) At 72 hpf, the total length of the compound mutant body (red arrowheads) is dramatically reduced as compared to the slight reduction of ns and moderate reduction of gnl2 total embryo length. Furthermore, the head and eye size reduction is enhanced in compound mutants, indicating synergistic phenotypes. (C) Quantification of whole body length as % of WT body length. Statistics: Student′s t-test with p-values indicated in the graph. Error bars represent SD. Images are lateral view, anterior to the left and dorsal up. (D) Injection of 475 pg WT gnl2 mRNA and 500 pg WT ns mRNA results in partial rescue of the ns-/- and gnl2-/- phenotypes, respectively, as characterized by the increased size of the total embryo, head and eyes as compared to uninjected controls (uic). The number of embryos injected is indicated above the bars. Statistics: two-tailed Fisher′s exact probability test for a table of frequency data with p-values indicated above the bar. Scalebar 250 μm. |
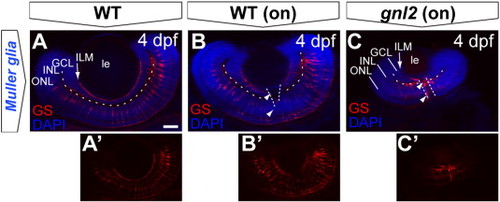
Disorganized Müller glial cells in the gnl2 retina. Single z-plane of whole-mount embryos at 4 dpf labeled with antibody to glutamine synthase, outlining the soma and processes in WT (A and B) versus gnl2 mutant (C). The Müller glial endfeet are ending at the inner limiting membrane (arrow). In gnl2 mutants, the Müller glial somata localization in the INL is disorganized. In addition, glutamine synthase-immunoreactive cells are lining the optic nerve head (arrowheads). Dashed lines are outlining the boundary between GCL and INL and the optic nerve head. GCL, ganglion cell layer; INL, inner nuclear layer; ILM, inner limiting membrane; le, lens; ONL, outer nuclear layer. Scalebar 25 μm. |
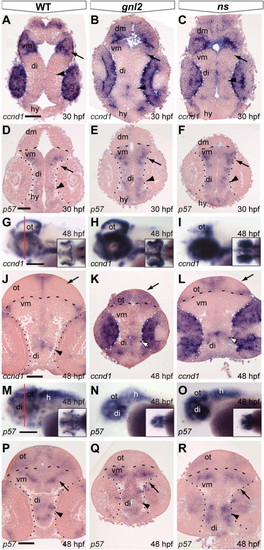
Differential expression of ccnd1 and p57 in the gnl2 and ns brain and retina. (A–C) Coronal sections showing expression of ccnd1 is expanded in the gnl2 (n = 5; B) and ns (n = 4; C) midbrain (arrow) and diencephalon (arrowhead) as compared to WT embryos at 30 hpf. Dotted lines indicate boundary between retina and brain. (D–F) Expression of the cell cycle inhibitor p57kip2 in the retina and brain at 30 hpf. At 30 hpf, there is no p57kip2 expression in the gnl2 (n = 4; E) and ns mutant retina (n = 4; F), whereas p57kip2 is expanded in the mutant diencephalon (arrowhead) and ventral midbrain (arrow) as compared to WT embryos (D). Dashed lines indicate the boundary between dorsal and ventral midbrain. Dotted lines indicate the boundary between retina and brain. Dorsal up. (G–I) Whole-mount labeling of ccnd1 transcript shows upregulation in the gnl2 (n = 9; H) and ns (n = 9; I) optic tectum, cerebellum and eye at 48 hpf. Lateral view, dorsal up. Insets show dorsal view. Red line in (G) indicates level of sectioning in (J–L). (J–L) Coronal sections show expansion of ccnd1 in the gnl2 (K) and ns (L) mutant optic tectum (arrow) and diencephalon (arrowhead) and retina as compared to WT embryos (J). (M and N) Whole-mount view of p57kip2 expression shows upregulation in the ventral brain of gnl2 (n = 12; N) and ns (n = 13; O) embryos as compared to WTs (M). Lateral view, dorsal is up. Insets show dorsal view. Red line in (M) indicates level of sectioning of (P–R). (P–R) Coronal sections showing expanded p57kip2 expression in the ventral midbrain (arrow) and parts of the diencephalon (arrowheads) of gnl2 (Q) and ns (R) mutants. di, diencephalon; dm, dorsal midbrain; hy, hypothalamus; ot, optic tectum; vm, ventral midbrain. Scalebar 50 μm. |
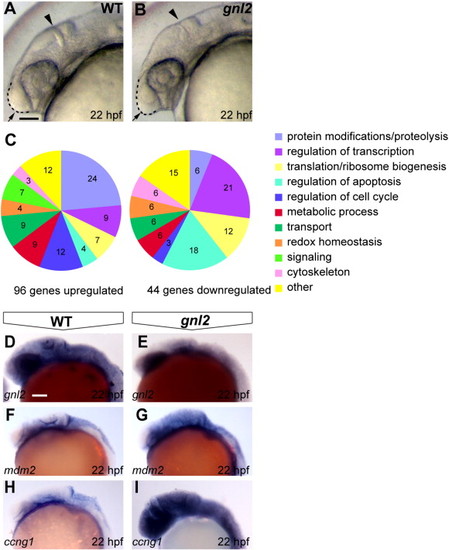
Gene expression changes upon Gnl2 LOF. (A and B) The earliest morphologically apparent phenotype of gnl2 mutants at 22 hpf, consisting of reduced forebrain (arrow and dashed lines), a thinner mid/hindbrain boundary (arrowhead) and smaller eyes. (C) Differentially expressed genes upon loss of Gnl2 at 22 hpf, categorized according to Gene Ontology (GO) function. A GO function was found for 23 out of the 44 total downregulated genes and 64 out of 96 total upregulated genes. (D–I) Confirmation of reduced expression of gnl2 (D and E; n = 9) and increased expression of the direct p53 transcriptional targets mdm2 (F and G; n = 6) and ccng1 (H and I; n = 7) in gnl2 mutants (E, G and I) as shown by in situ hybridization. All images are lateral view, anterior to the left. Scalebar 125 μm. |
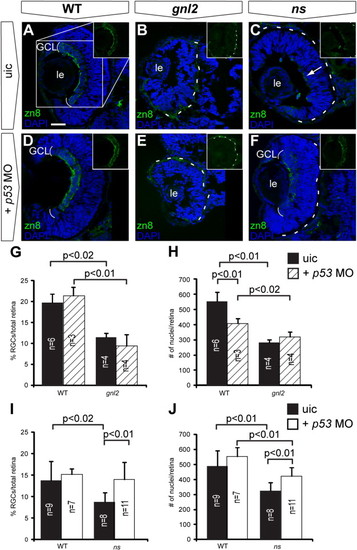
Stabilization of p53 affects early retinal differentiation in ns but not gnl2 mutants. Confocal images of immunolabelings to the RGC marker zn8 (green) with DAPI nuclear counterstaining (blue) on coronal sections of uninjected control embryos (A–C) as compared to p53 MO-injected embryos (D–F). Injection of p53 MO did not affect RGC differentiation in WT (A and D), nor did it improve RGC differentiation in gnl2 mutant (B and E) embryos at 48 hpf. In contrast, in the ns mutant, injection of p53 MO resulted in the development of a distinct RGC layer at 48 hpf (F), whereas the uninjected ns mutants had a poorly formed RGC layer (arrow in C). Insets show magnification of single zn8 fluorescence (as indicated in box in A). The dashed lines indicate the outline of the retina. (G) Quantifications of the proportion of zn8+ cells in the total retina in WT and gnl2 mutants with or without injection of 1 ng of p53 MO. Upon p53 MO injection, the percentage of RGCs is unchanged in WT and gnl2 mutants at 48 hpf. (H) Quantification of the total number of retinal cells shows that p53 MO does not improve the reduction in cell counts in the gnl2 mutant retina. (I and J) Quantifications of the proportion of zn8+ cells (I) and total number of cells (J) in WT and ns mutant retina at 48 hpf with or without injection of 1 ng of p53 MO. Upon p53 MO injection, the percentage of RGCs is significantly increased in ns mutants (I). In addition, p53 MO injection significantly increases the total number of cells found in the retina (J), although it is still reduced as compared to WT embryos. Statistics: Student′s t-test, p-values and experimental numbers shown in graph. Error bars represent SD. GCL, ganglion cell layer; le, lens; uic, uninjected control. Scalebar 25 μm. |

Gnl2 and NS act non-cell autonomously in retinal cell cycle exit and neuronal differentiation. (A and B) Single-plane confocal images of clones of transplanted cells showing DAPI-counterstained nuclei (cyan, top left), streptavidin-Alexa488 (green, top right), EdU (white, bottom left) and zn8-stained RGCs (magenta, bottom right). Clones of transplanted cells are outlined by dotted lines (white or green). The retina is outlined with dashed white lines. Shown are clones transplanted from WT donor to WT host (A) and WT donor to ns mutant host (B). (C and D) Quantification of the percentage of EdU+ (C) and zn8+ RGCs (D) within transplanted clones for WT→WT and WT→ns mutant. Statistics: Two-tailed Student′s t-test, p-values indicated above the bars (*p < 0.01, **p < 0.02). Error bars represent standard deviation. (E) Quantification of the percentage of EdU+ (striped bars) and zn8+ RGCs (black bars) within transplanted clones for additional experimental groups regarding gnl2 in addition to the data shown in Fig. 7F (with the exception of WT→WT and WT→gnl2 mutant which are shown in both Fig. 7F and here). |

Statistics: Two-tailed Student′s t-test, p-values indicated above the bars (*p < 0.01, **p < 0.02). Error bars represent standard deviation. (F–I) Single-plane confocal images of clones of transplanted cells showing DAPI-counterstained nuclei (cyan, top left), streptavidin-Alexa488 (green, top right), EdU (white, bottom left) and zn8-stained RGCs (magenta, bottom right). Clones of transplanted cells are outlined by dotted lines (white or green). The retina is outlined with dashed white lines. Shown are large clones transplanted from WT donor to WT host (F) and WT donor to gnl2 mutant host (G). In addition, images of clones from WT donor to 5 ng gnl2-injected hosts (H) and 5 ng gnl2-injected donors to 5 ng gnl2-injected hosts (I) are shown. Scalebar 25 μm. |
Reprinted from Developmental Biology, 355(2), Paridaen, J.T., Janson, E., Utami, K.H., Pereboom, T.C., Essers, P.B., van Rooijen, C., Zivkovic, D., and Macinnes, A.W., The nucleolar GTP-binding proteins Gnl2 and nucleostemin are required for retinal neurogenesis in developing zebrafish, 286-301, Copyright (2011) with permission from Elsevier. Full text @ Dev. Biol.