
FIGURE
Fig. 3
- ID
- ZDB-FIG-110929-20
- Publication
- Greenhill et al., 2011 - An iterative genetic and dynamical modelling approach identifies novel features of the gene regulatory network underlying melanocyte development
- Other Figures
- All Figure Page
- Back to All Figure Page
Fig. 3
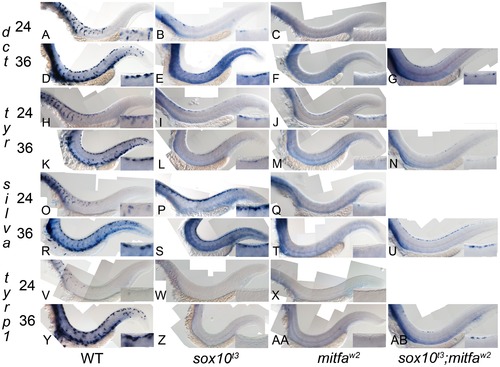
Residual melanocyte marker expression in sox10, mitfa, and sox10;mitfa mutants. A–AB) Expression of dct, tyr, silva and tyrp1b in wild-type (WT), sox10t3, mitfaw2 and sox10t3; mitfaw2 mutants is shown at 24 and 36 hpf as indicated. Insets in each panel show enlargement of area of dorsal posterior trunk. Note the pronounced derepression of silva and dct, mild derepression of tyr, and minimal residual expression of tyrp1. Note that all in situs were over-developed in order to detect low level expression. |
Expression Data
| Genes: | |
|---|---|
| Fish: | |
| Anatomical Term: | |
| Stage Range: | Prim-5 to Prim-25 |
Expression Detail
Antibody Labeling
Phenotype Data
Phenotype Detail
Acknowledgments
This image is the copyrighted work of the attributed author or publisher, and
ZFIN has permission only to display this image to its users.
Additional permissions should be obtained from the applicable author or publisher of the image.
Full text @ PLoS Genet.