
FIGURE
Fig. 4
- ID
- ZDB-FIG-110929-21
- Publication
- Greenhill et al., 2011 - An iterative genetic and dynamical modelling approach identifies novel features of the gene regulatory network underlying melanocyte development
- Other Figures
- All Figure Page
- Back to All Figure Page
Fig. 4
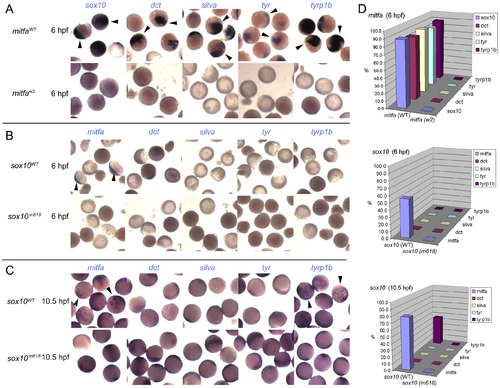
Induction of Mitfa-responsive genes is largely suppressed by Sox10. Representative groups of wild-type embryos are shown after injection of mRNA as indicated to left (mitfa (A) and sox10, assayed at 6 hpf (B) or 10.5 hpf (C)), raised to stage indicated, then fixed and processed by in situ hybridisation to detect genes named above panels (purple). Arrowheads indicate specific signal above background levels. D) Data is quantified as percentage of injected embryos showing expression in graphs at right (n>44 in each case). |
Expression Data
Expression Detail
Antibody Labeling
Phenotype Data
Phenotype Detail
Acknowledgments
This image is the copyrighted work of the attributed author or publisher, and
ZFIN has permission only to display this image to its users.
Additional permissions should be obtained from the applicable author or publisher of the image.
Full text @ PLoS Genet.