
- Title
-
Zebrafish model reveals developmental and hematopoietic functions of ADAMTS13
- Authors
- Sartori, S., Chust, I.B., Varinelli, M., Mattè, A., Trionfini, P., Tomasoni, S., Poggi, L.
- Source
- Full text @ Biol. Open
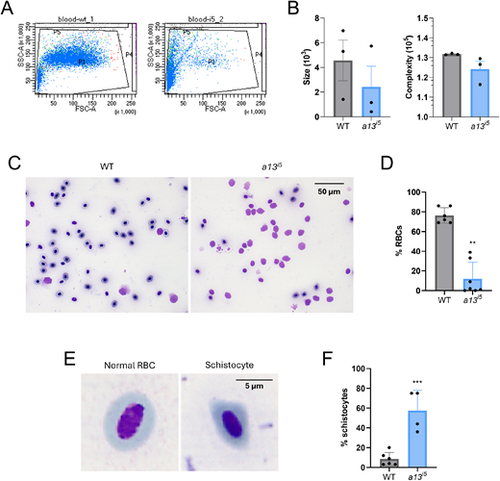
Depletion of erythrocytes and presence of schistocytes in the peripheral blood of adamts13i5 mutants. (A) flow cytometry analysis of the peripheral blood of adult zebrafish. (B) Analysis of the size (left) and complexity (right) of WT (grey) and a13i5 (blue) fish. (C) Representative peripheral blood smears of the erythrocytes. (D) Quantification of the RBCs in the peripheral blood of adult zebrafish: WT (grey), a13i5 (blue). (E) Illustrative comparison between a normal RBC and a schistocyte. (F) Quantification of SCs in the peripheral blood of adult zebrafish: WT (grey), a13i5 (blue). Data are shown as means±s.d. of 3-7 biological replicates. Each dot represents a single adult fish. **P≤0.01 and ***P≤0.001 by two-tailed Student's t-test. Blood smear images were obtained using a 63× oil-immersion objective. PHENOTYPE:
|
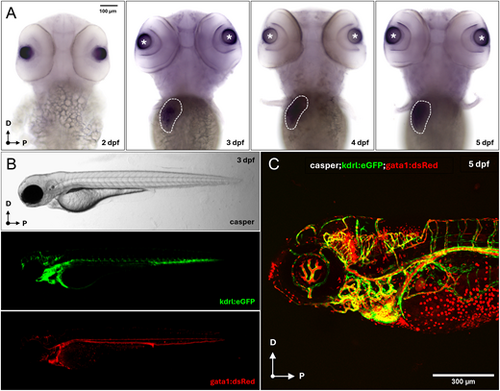
adamts13 expression in the zebrafish liver primordium. (A) Dorsal view of 2, 3, 4 and 5 dpf WT embryos stained through WISH using a DIG-labeled antisense RNA probe against adamts13 (anterior to the top). Specific expression was detected at the level of the liver primordium (white dashed circle) starting from 3 dpf. Magnification: 10×. Scale bar: 100 μm. (B) Lateral view of a 3 dpf casper;kdrl:eGFP;gata1:dsRed embryo at the stereomicroscope (anterior to the left), labeling the blood vessels (green) and the erythrocytes (red). (C) Lateral view of a 5 dpf casper;kdrl:eGFP;gata1:dsRed embryo at the confocal microscope with the two transgenes merged together. 20× dry objective. Scale bar: 300 μm. EXPRESSION / LABELING:
|
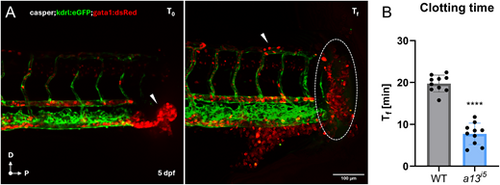
Accelerated clotting in the absence of ADAMTS13. (A) Representative confocal images of a casper;kdrl:eGFP;gata1:dsRed zebrafish at 5 dpf at time 0 (T0) and at the final clotting time (Tf). (B) Quantification of the clotting time (Tf in minutes) in WT (grey) and a13i5 (blue) zebrafish larvae. Data are shown as means±s.d. Each dot represents a single embryo. ****P≤0.0001 by two-tailed Student's t-test. Scale bar: 100 µm. PHENOTYPE:
|
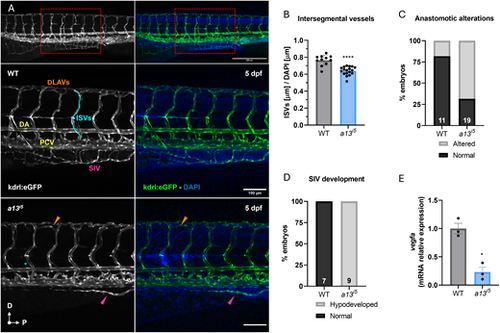
ADAMTS13 deficiency impairs vascular developmental patterning. (A) Representative confocal images of the trunk vasculature of casper;kdrl:eGFP transgenic zebrafish at 5 dpf. Top panels show an overview of the tail vasculature (10×), the red rectangle highlights the area of the trunk considered for the analysis. Scale bar: 300 μm. Mid panels show a WT embryo, kdrl:eGFP in grey (left), and the merge with DAPI (right). Lower panels show an a13i5 mutant embryo, kdrl:eGFP in grey (left) and the merge with DAPI (right). Scale bar: 100 μm. (B) Quantification of ISV length (µm) normalized to DAPI in WT (grey) and a13i5 (blue) embryos. (C) Percentage of embryos with normal (black) or altered (grey) anastomotic connections in WT and a13i5 mutants. (D) Percentage of embryos with normal (black) or hypodeveloped (grey) SIV plexus in WT and a13i5 mutants. (E) Relative mRNA expression levels of vegfa in WT and a13i5 embryos, normalized to the housekeeping gene ube2a, and shown as fold versus WT. Data are shown as mean±s.d. Each dot represents a biological replicate. *P≤0.05, **** P≤0.0001 by unpaired Student's t-test. DA, dorsal aorta; DLAV, dorsal longitudinal anastomotic vessel; ISV, intersegmental vessel; PCV, posterior cardinal vein; SIV, subintestinal vein. |
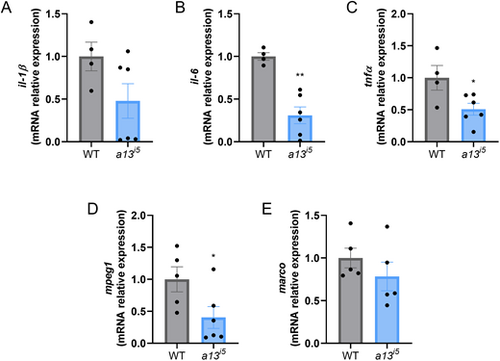
ADAMTS13 regulates inflammation. mRNA expression of the pro-inflammatory cytokines il-1β (A), il-6 (B), tnfα (C) and the macrophage-specific markers mpeg1 (D) and marco (E) in WT (grey) and a13i5 mutants (blue) at 5 dpf. mRNA expression was measured by RT-qPCR, normalized to the housekeeping gene ube2a, and shown as fold versus WT. Each dot represents a pull of 20 embryos. Data are shown as mean±s.d. of four independent experiments. *P≤0.05, **P≤0.01 and ***P≤0.001 by two-tailed Student's t-test. |
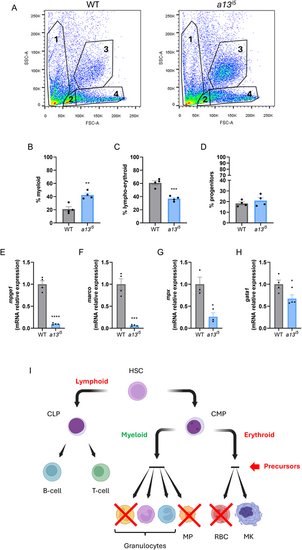
ADAMTS13 is required for proper hematopoietic lineage maturation in the adult zebrafish. (A-D) Flow cytometry analysis of kidney marrow-derived cells from WT (grey) and a13i5 (blue) adult zebrafish. (A) Gating strategy highlighting the main KM cell populations: cell debris (1), lympho-erythroid (2), myeloid (3) and early progenitors (4). Bar graphs represent the relative proportions of myeloid (B), lympho-erythroid (C), and progenitor (D) cell populations. (E-H) RT-qPCR analysis of lineage-specific gene expression in WT and a13i5 mutants. Expression of the macrophage markers mpeg1 (E) and marco (F), the neutrophil marker mpx (G) and the erythroid marker gata1 (H) normalized to the housekeeping gene ube2a and shown relative to the WT. Data are represented as mean±s.d. Each dot represents a biological replicate. Statistical analysis was performed using a two-tailed Student's t-test: *P≤0.05, **P≤0.01, ***P≤0.001, ****P≤0.0001. (I) Summary scheme of the effect of the lack of adamts13 on hematopoietic lineage specification. HSC, hematopoietic stem cell; CLP, common lymphoid progenitor; CMP, common myeloid progenitor; MP, macrophage; RBC, red blood cell; MK, megakaryocyte. |