|
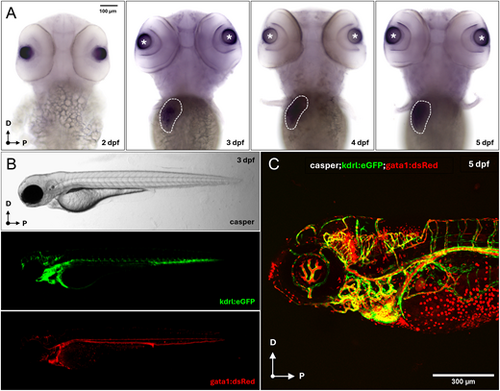
adamts13 expression in the zebrafish liver primordium. (A) Dorsal view of 2, 3, 4 and 5 dpf WT embryos stained through WISH using a DIG-labeled antisense RNA probe against adamts13 (anterior to the top). Specific expression was detected at the level of the liver primordium (white dashed circle) starting from 3 dpf. Magnification: 10×. Scale bar: 100 μm. (B) Lateral view of a 3 dpf casper;kdrl:eGFP;gata1:dsRed embryo at the stereomicroscope (anterior to the left), labeling the blood vessels (green) and the erythrocytes (red). (C) Lateral view of a 5 dpf casper;kdrl:eGFP;gata1:dsRed embryo at the confocal microscope with the two transgenes merged together. 20× dry objective. Scale bar: 300 μm.
|