
FIGURE
Fig. 3
- ID
- ZDB-FIG-251103-30
- Publication
- Sartori et al., 2025 - Zebrafish model reveals developmental and hematopoietic functions of ADAMTS13
- Other Figures
- All Figure Page
- Back to All Figure Page
Fig. 3
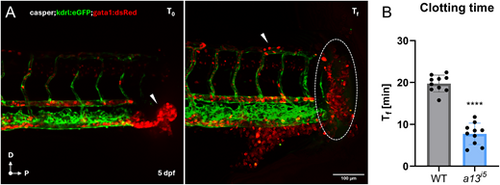
Accelerated clotting in the absence of ADAMTS13. (A) Representative confocal images of a casper;kdrl:eGFP;gata1:dsRed zebrafish at 5 dpf at time 0 (T0) and at the final clotting time (Tf). (B) Quantification of the clotting time (Tf in minutes) in WT (grey) and a13i5 (blue) zebrafish larvae. Data are shown as means±s.d. Each dot represents a single embryo. ****P≤0.0001 by two-tailed Student's t-test. Scale bar: 100 µm. |
Expression Data
Expression Detail
Antibody Labeling
Phenotype Data
| Fish: | |
|---|---|
| Observed In: | |
| Stage: | Day 5 |
Phenotype Detail
Acknowledgments
This image is the copyrighted work of the attributed author or publisher, and
ZFIN has permission only to display this image to its users.
Additional permissions should be obtained from the applicable author or publisher of the image.
Full text @ Biol. Open