FIGURE SUMMARY
Title

Identification of renal stem cells in zebrafish

Authors
Yu, T., Liu, X., Tan, X., Zhang, Y., He, Z., Yang, W., Tian, T., Li, Y., Zhao, J., Liu, C.
Source
Full text @ Sci Adv

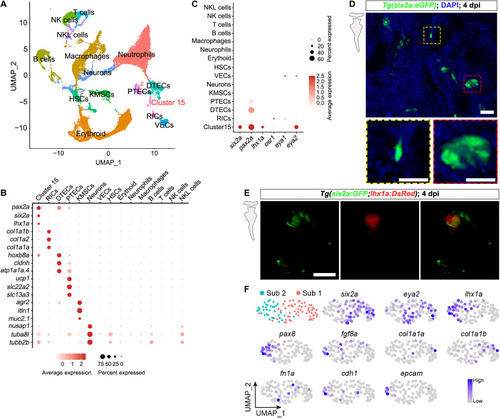
Identification of potential zebrafish RSC clusters via scRNA-seq analysis of injured kidneys.

(A) Uniform Manifold Approximation and Projection (UMAP) plot analysis identified a previously undefined cell cluster (cluster 15) in the zebrafish kidney. (B) Dot plot displaying the relative expression of markers for various kidney cell clusters. Cluster 15 expresses markers associated with mammalian RPCs. (C) Dot plot showing the relative expression of six2a, pax2a, lhx1a, osr1, eya1, and eya2 across kidney cell clusters. All these genes, except eya1 and osr1, are highly expressed in cluster 15. (D) Confocal image of adult Tg(six2a:eGFP) kidneys at 4 dpi. The red dashed box outlines a cell aggregate, while the yellow dashed box highlights a dendritically shaped mesenchymal cell. The grayscale image on the left indicates that the image was captured in the adult kidney. (E) Confocal images of adult Tg(six2a:eGFP;lhx1a:DsRed) kidneys at 4 dpi, showing numerous six2a+ cells that are not labeled by lhx1a. (F) UMAP plot showing the identification of RSC subtypes following subclustering of cluster 15 from (A). UMAP feature plots indicate that subpopulation 1 exhibits high expression of six2a, eya2, col1a1a, col1a1b, and fn1a, whereas subpopulation 2 is characterized by high expression of lhx1a, pax8, fgf8a, cdh1, and epcam. NK, natural killer; VECs, vascular endothelial cells; DTECs, distal tubular epithelial cells; HSCs, hematopoietic stem cells; KMSCs, kidney mucin–secreting cells; RICs, renal interstitial cells. Scale bars, 50 μm [(D) and (E)]. PTECs, proximal tubular epithelial cells; NKL, natural killer T-like cells.

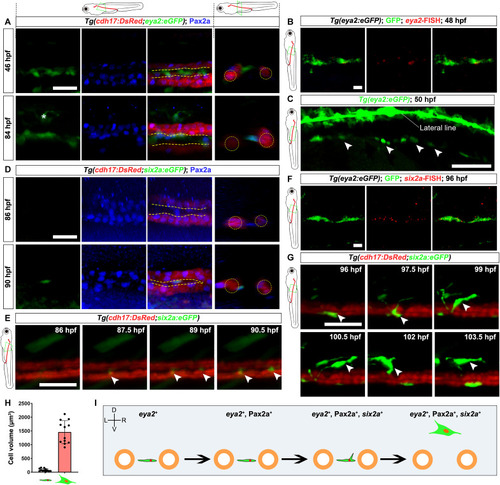
RSC generation process.

(
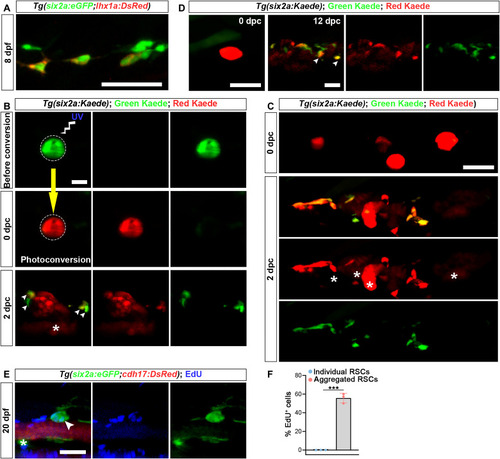
A) Confocal images of Pax2a immunofluorescence in Tg(cdh17:DsRed;eya2:eGFP) zebrafish show that eya2+ cells emerge at 46 hpf, and these cells start expressing Pax2a by 84 hpf. cdh17:DsRed labels renal tubular epithelial cells. The asterisk indicates other eya2:eGFP+ cell types that have yet to be identified. The yellow dashed lines indicate the intermediate region between the two renal tubules. The line diagram at the top indicates that the images were captured from zebrafish embryos. The red lines represent the renal tubules, while the green box indicates the region and orientation of image acquisition. (B) Combination of eya2-FISH and GFP immunofluorescence in Tg(eya2:eGFP) zebrafish at 48 hpf. (C) Confocal image showing Tg(eya2:eGFP) zebrafish at 50 hpf. Arrowheads indicate RSCs arranged in a cord-like structure. The structure above it is the lateral line. (D) Confocal images of Pax2a immunofluorescence in Tg(cdh17:DsRed;six2a:eGFP) zebrafish at 86 and 90 hpf, demonstrating that six2a is first expressed at 90 hpf. (E) Time-lapse observation of Tg(six2a:eGFP;cdh17:DsRed) zebrafish from 86 to 90.5 hpf. Arrowheads indicate six2a:eGFP+ RSCs. (F) Combination of six2a-FISH and GFP immunofluorescence in Tg(eya2:eGFP) zebrafish at 96 hpf. (G) Time-lapse observation of Tg(cdh17:DsRed;six2a:eGFP) zebrafish from 96 to 103.5 hpf. Arrowheads indicate six2a:eGFP+ RSC. (H) The cell volume of six2a:eGFP+ RSCs in (G) (96 and 103.5 hpf) was measured using ImageJ (n = 12 cells from three fish). (I) Graphical abstract summarizing RSC generation. A subset of eya2+ mesenchymal cells begins to express Pax2a at approximately 84 hpf, followed by the expression of six2a, which facilitates the maturation of RSCs. Yellow circles represent cross sections of the pronephric tubules, and green cells denote RSCs. Axial orientation is shown in the top left corner, indicating the dorsal (D)–ventral (V) and left (L)–right (R) axes. Scale bars, 50 μm [(A) to (G)].

Renewal of RSCs.

(A) Confocal images of Tg(six2a:eGFP;lhx1a:DsRed) zebrafish at 8 dpf show that six2a:eGFP+ RSCs begin to express lhx1a at this stage. (B) Confocal images showing six2a:Kaede+ RSC aggregate before and after photoconversion. Only the circled area was photoconverted. The asterisk indicates red Kaede+ nascent nephrons, while arrowheads indicate nascent RSCs. dpc, days postphotoconversion. (C) In individuals where all RSCs that had formed aggregates were photoconverted, nascent RSCs exhibited red fluorescence at 2 dpc. Asterisks indicate red Kaede+ nascent nephrons. (D) Long-term photoconversion-based lineage tracing revealed that nascent RSCs were capable of forming cell aggregates in newly formed nephrons at 12 dpc. Arrowheads indicate newly formed RSC aggregates. (E) EdU assay of Tg(six2a:eGFP;cdh17:DsRed) zebrafish at 20 dpf. EdU incorporation is primarily observed in RSC aggregate (arrowhead) rather than in individual RSCs (asterisk). (F) Quantification of EdU+ RSCs from (E), showing the proportion of EdU+ cells within aggregates or as individual RSCs. n = 3 fish, with 30 cells analyzed per group within each fish. Scale bars, 50 μm [(A) to (E)].

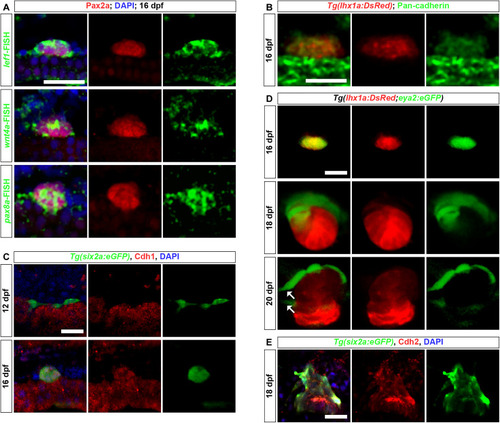
MET and EMT processes during RSC renewal.

(A) The combination of lef1, wnt4a, and pax8 FISH with Pax2a immunofluorescence shows high expression of lef1, wnt4a, and pax8 in Pax2a+ RSC aggregates at 16 dpf. (B) Pan-cadherin immunofluorescence in Tg(lhx1a:DsRed) zebrafish at 16 dpf indicates that RSCs begin to establish cell junctions after aggregation. (C) Cdh1 immunofluorescence in Tg(six2a:eGFP) zebrafish shows that RSC aggregates begin to express the MET marker Cdh1 after aggregation. (D) Confocal images of Tg(lhx1a:DsRed;eya2:eGFP) zebrafish at 16, 18, and 20 dpf. Arrows indicate newly formed individual RSCs. (E) Cdh2 immunofluorescence in Tg(six2a:eGFP) zebrafish shows that RSC aggregates highly express the EMT marker Cdh2 during the generation of new RSCs. Scale bars, 50 μm [(A) to (E)]. DAPI, 4′,6-diamidino-2-phenylindole.

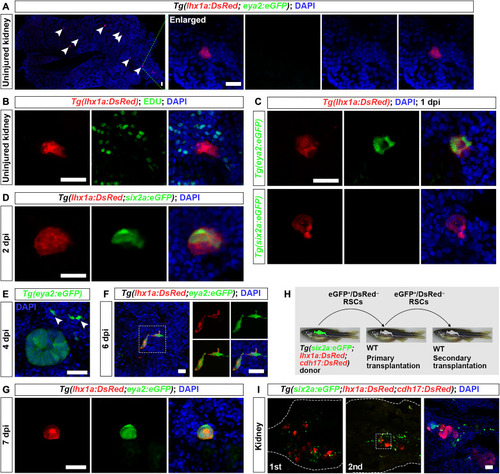
Renewal of RSCs in adult kidneys.

(A) Confocal images of uninjured adult Tg(lhx1a:DsRed;eya2:eGFP) kidney sections showing lhx1a:DsRed+ RSC aggregates, with the cell aggregate (indicated by arrowheads) magnified for detailed observation. At this stage, RSC aggregates do not express eya2:eGFP. (B) EdU assay of uninjured Tg(lhx1a:DsRed) kidney sections. EdU was administered intraperitoneally every third day until kidney collection for analysis. Results show that most RSC aggregates are not labeled by EdU. (C) Confocal images of Tg(lhx1a:DsRed;eya2:eGFP) and Tg(lhx1a:DsRed;six2a:eGFP) kidney sections at 1 dpi, showing that the aggregates begin to express eya2:eGFP but not six2a:eGFP. Each RSC aggregate contains approximately 20 cells at this stage. (D) Confocal images of Tg(lhx1a:DsRed;six2a:eGFP) kidney sections at 2 dpi, showing the appearance of six2a:eGFP+ cells. By this stage, the RSC aggregates expand to approximately 50 cells. (E) Confocal images of Tg(eya2:eGFP) kidney sections at 4 dpi, indicating that nascent RSCs emerge. Arrowheads indicate individual RSCs. (F and G) Confocal images of Tg(lhx1a:DsRed;eya2:eGFP) kidney sections at 6 dpi (F) and 7 dpi (G), showing that nascent RSCs begin to express lhx1a and aggregate to form new cell aggregates. (H) Schematic of the serial transplantation assay. (I) Confocal images showing donor-derived nephrons (cdh17:DsRed+) and RSCs (six2a:eGFP+) in primary and secondary engrafted recipients. White dashed lines indicate the boundary of the kidney. Scale bars, 50 μm [(A) to (E) and (G) to (I)] and 10 μm (F).

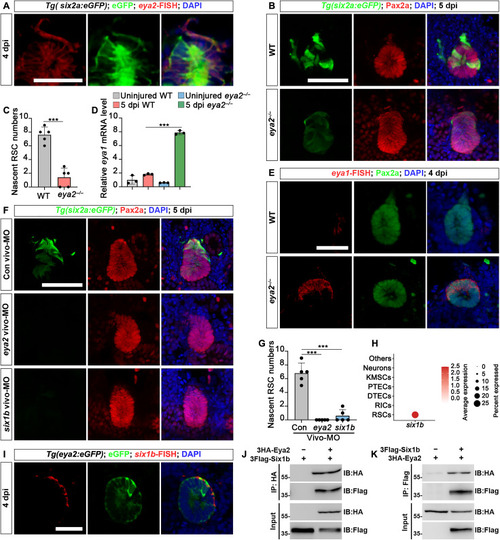
Eya2-Six1b complex regulates RSC renewal.

(A) Combination of eya2-FISH and GFP immunofluorescence in Tg(six2a:eGFP) zebrafish at 4 dpi. (B) Confocal images of Pax2a immunofluorescence in Tg(eya2:eGFP) kidney sections show a significant reduction of nascent RSCs in eya2−/− kidneys compared to WT at 5 dpi. (C) Quantification of nascent six2a:eGFP+ RSCs in WT and eya2−/− zebrafish kidney sections from (A). n = 5 cell aggregates for both groups. (D) qRT-PCR analysis of eya1 expression in WT and eya2−/− zebrafish kidneys, both uninjured and at 5 dpi. The data are presented as fold changes relative to eya1 levels in the uninjured WT. (E) Combination of eya1 FISH and Pax2a immunofluorescence in eya2−/− zebrafish at 4 dpi. (F) Confocal images of adult Tg(six2a:eGFP) kidneys at 5 dpi following administration of control vivo-MO, eya2 vivo-MO, or six1b vivo-MO at −1, 2, and 4 dpi. (G) Quantification of the number of six2a:eGFP+ RSCs around cell aggregates in (F). n = 5 cell aggregates for all groups. (H) Dot plot showing the relative expression of six1b in different kidney cell types. (I) At 4 dpi, six1b FISH in Tg(eya2:eGFP) kidneys demonstrated the coexpression of eya2 and six1b in RSCs. (J and K) Coimmunoprecipitation assay demonstrating the interaction between Eya2 and Six1b. 3HA-Eya2 and 3Flag-Six1b were coexpressed in HEK293T cells. The data in [(C), (D), and (G)] were analyzed using a two-sided t test and are presented as mean values ± SD. ***P < 0.001. Scale bars, 100 μm [(A) to (I)]. IB, immunoblotting.

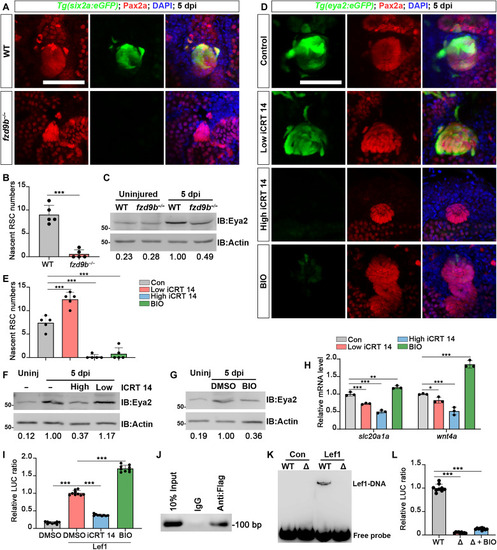
Wnt regulates the renewal of RSCs by directly activating eya2 expression.

(A) Pax2a immunofluorescence in Tg(six2a:eGFP) kidney sections shows reduced RSC renewal in fzd9b−/− zebrafish at 5 dpi. (B) Quantification of RSCs generated per aggregate in WT and fzd9b−/− kidneys (A, n = 5). (C) Western blot of Eya2 levels in WT and fzd9b−/− kidneys at 5 dpi, normalized to actin and expressed as fold change relative to WT. (D) Confocal images of adult Tg(eya2:eGFP) kidneys at 5 dpi, treated with Low iCRT 14 (5 μM, 10 μl per fish), high iCRT 14 (80 μM, 10 μl per fish), BIO (10 μM, 10 μl per fish), or dimethyl sulfoxide (DMSO; 0.1%, 10 μl per fish) at 2 and 4 dpi. (E) Quantification of the number of RSCs generated per aggregate (D, n = 5). (F and G) Western blot analysis of Eya2 levels in uninjured kidneys and kidneys at 5 dpi after administration (at 2 and 4 dpi) of iCRT 14, BIO, or DMSO. (H) qRT-PCR analysis of slc20a1a and wnt4a expression in kidneys at 5 dpi after administration (at 2 and 4 dpi) of low iCRT 14, high iCRT 14, BIO, or DMSO, expressed as fold change versus WT. (I) Relative eya2 promoter–driven luciferase (LUC) activity measured in HEK293T cells and lef1-overexpressed HEK293T cells after administration of iCRT 14 (40 μM), BIO (0.6 μM), or 0.1% DMSO. (J) Chromatin immunoprecipitation followed by polymerase chain reaction (ChIP-PCR) confirming Lef1 binding to the predicted genomic site in zebrafish embryos (n = 9). (K) EMSA shows Lef1 binds eya2 promoter sequence 5′-CATCAAAG-3′ (Δ: sequence deleted). (L) Relative eya2 promoter–driven LUC activity measured in lef1-overexpressed HEK293T cells (n = 9). The data in [(B), (E), (H), (I), and (L)] were analyzed by a two-sided t test, mean ± SD; *P < 0.05, **P < 0.01, and ***P < 0.001. Scale bars, 100 μm [(A) and (D)].

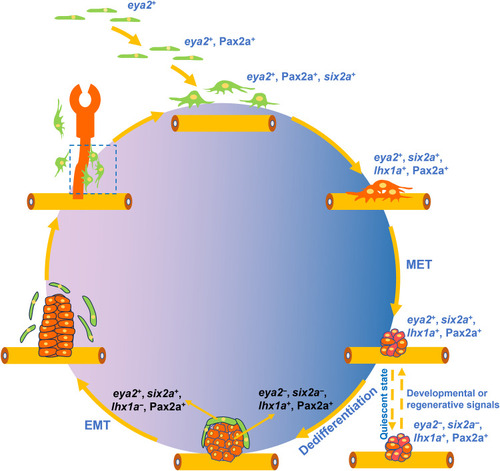
Schematic overview of zebrafish RSC renewal and differentiation.

During zebrafish embryonic development, RSCs arise from eya2+ mesenchymal cells (shown as green cells). These cells then express Pax2a and six2a, maturing into functional RSCs. By 8 dpf, they begin expressing lhx1a (indicated as red cells) and aggregate, undergoing a MET to form compact cell aggregates. In the absence of developmental or injury-related signals, these aggregates enter a quiescent state. Upon reappearance of such signals, the aggregates reactivate: Base cells differentiate into nephrons, while apex cells regenerate RSCs through dedifferentiation and EMT. The newly formed RSCs reenter a cycle of generating new nephrons and additional RSCs.

Acknowledgments
This image is the copyrighted work of the attributed author or publisher, and ZFIN has permission only to display this image to its users. Additional permissions should be obtained from the applicable author or publisher of the image. Full text @ Sci Adv