|
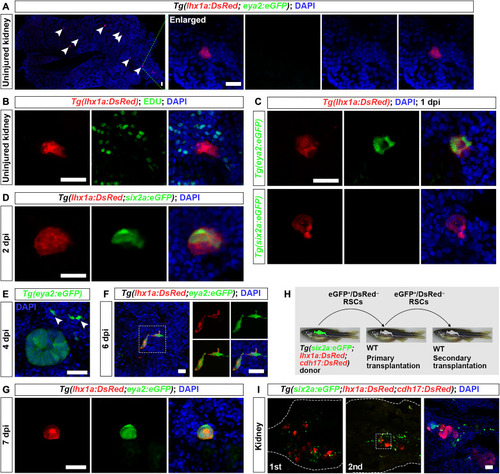
Renewal of RSCs in adult kidneys. (A) Confocal images of uninjured adult Tg(lhx1a:DsRed;eya2:eGFP) kidney sections showing lhx1a:DsRed+ RSC aggregates, with the cell aggregate (indicated by arrowheads) magnified for detailed observation. At this stage, RSC aggregates do not express eya2:eGFP. (B) EdU assay of uninjured Tg(lhx1a:DsRed) kidney sections. EdU was administered intraperitoneally every third day until kidney collection for analysis. Results show that most RSC aggregates are not labeled by EdU. (C) Confocal images of Tg(lhx1a:DsRed;eya2:eGFP) and Tg(lhx1a:DsRed;six2a:eGFP) kidney sections at 1 dpi, showing that the aggregates begin to express eya2:eGFP but not six2a:eGFP. Each RSC aggregate contains approximately 20 cells at this stage. (D) Confocal images of Tg(lhx1a:DsRed;six2a:eGFP) kidney sections at 2 dpi, showing the appearance of six2a:eGFP+ cells. By this stage, the RSC aggregates expand to approximately 50 cells. (E) Confocal images of Tg(eya2:eGFP) kidney sections at 4 dpi, indicating that nascent RSCs emerge. Arrowheads indicate individual RSCs. (F and G) Confocal images of Tg(lhx1a:DsRed;eya2:eGFP) kidney sections at 6 dpi (F) and 7 dpi (G), showing that nascent RSCs begin to express lhx1a and aggregate to form new cell aggregates. (H) Schematic of the serial transplantation assay. (I) Confocal images showing donor-derived nephrons (cdh17:DsRed+) and RSCs (six2a:eGFP+) in primary and secondary engrafted recipients. White dashed lines indicate the boundary of the kidney. Scale bars, 50 μm [(A) to (E) and (G) to (I)] and 10 μm (F).
|