|
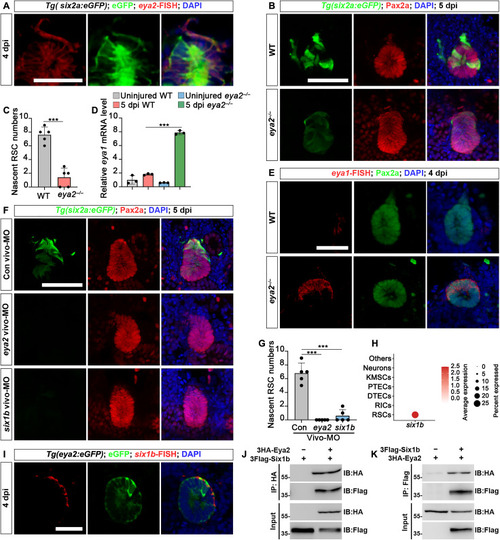
Eya2-Six1b complex regulates RSC renewal. (A) Combination of eya2-FISH and GFP immunofluorescence in Tg(six2a:eGFP) zebrafish at 4 dpi. (B) Confocal images of Pax2a immunofluorescence in Tg(eya2:eGFP) kidney sections show a significant reduction of nascent RSCs in eya2−/− kidneys compared to WT at 5 dpi. (C) Quantification of nascent six2a:eGFP+ RSCs in WT and eya2−/− zebrafish kidney sections from (A). n = 5 cell aggregates for both groups. (D) qRT-PCR analysis of eya1 expression in WT and eya2−/− zebrafish kidneys, both uninjured and at 5 dpi. The data are presented as fold changes relative to eya1 levels in the uninjured WT. (E) Combination of eya1 FISH and Pax2a immunofluorescence in eya2−/− zebrafish at 4 dpi. (F) Confocal images of adult Tg(six2a:eGFP) kidneys at 5 dpi following administration of control vivo-MO, eya2 vivo-MO, or six1b vivo-MO at −1, 2, and 4 dpi. (G) Quantification of the number of six2a:eGFP+ RSCs around cell aggregates in (F). n = 5 cell aggregates for all groups. (H) Dot plot showing the relative expression of six1b in different kidney cell types. (I) At 4 dpi, six1b FISH in Tg(eya2:eGFP) kidneys demonstrated the coexpression of eya2 and six1b in RSCs. (J and K) Coimmunoprecipitation assay demonstrating the interaction between Eya2 and Six1b. 3HA-Eya2 and 3Flag-Six1b were coexpressed in HEK293T cells. The data in [(C), (D), and (G)] were analyzed using a two-sided t test and are presented as mean values ± SD. ***P < 0.001. Scale bars, 100 μm [(A) to (I)]. IB, immunoblotting.
|