|
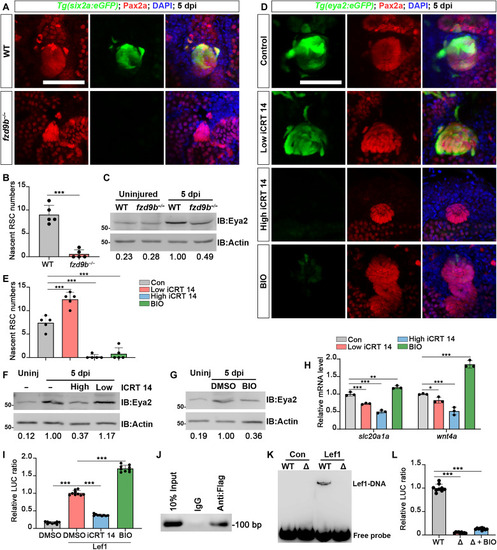
Wnt regulates the renewal of RSCs by directly activating eya2 expression. (A) Pax2a immunofluorescence in Tg(six2a:eGFP) kidney sections shows reduced RSC renewal in fzd9b−/− zebrafish at 5 dpi. (B) Quantification of RSCs generated per aggregate in WT and fzd9b−/− kidneys (A, n = 5). (C) Western blot of Eya2 levels in WT and fzd9b−/− kidneys at 5 dpi, normalized to actin and expressed as fold change relative to WT. (D) Confocal images of adult Tg(eya2:eGFP) kidneys at 5 dpi, treated with Low iCRT 14 (5 μM, 10 μl per fish), high iCRT 14 (80 μM, 10 μl per fish), BIO (10 μM, 10 μl per fish), or dimethyl sulfoxide (DMSO; 0.1%, 10 μl per fish) at 2 and 4 dpi. (E) Quantification of the number of RSCs generated per aggregate (D, n = 5). (F and G) Western blot analysis of Eya2 levels in uninjured kidneys and kidneys at 5 dpi after administration (at 2 and 4 dpi) of iCRT 14, BIO, or DMSO. (H) qRT-PCR analysis of slc20a1a and wnt4a expression in kidneys at 5 dpi after administration (at 2 and 4 dpi) of low iCRT 14, high iCRT 14, BIO, or DMSO, expressed as fold change versus WT. (I) Relative eya2 promoter–driven luciferase (LUC) activity measured in HEK293T cells and lef1-overexpressed HEK293T cells after administration of iCRT 14 (40 μM), BIO (0.6 μM), or 0.1% DMSO. (J) Chromatin immunoprecipitation followed by polymerase chain reaction (ChIP-PCR) confirming Lef1 binding to the predicted genomic site in zebrafish embryos (n = 9). (K) EMSA shows Lef1 binds eya2 promoter sequence 5′-CATCAAAG-3′ (Δ: sequence deleted). (L) Relative eya2 promoter–driven LUC activity measured in lef1-overexpressed HEK293T cells (n = 9). The data in [(B), (E), (H), (I), and (L)] were analyzed by a two-sided t test, mean ± SD; *P < 0.05, **P < 0.01, and ***P < 0.001. Scale bars, 100 μm [(A) and (D)].
|