|
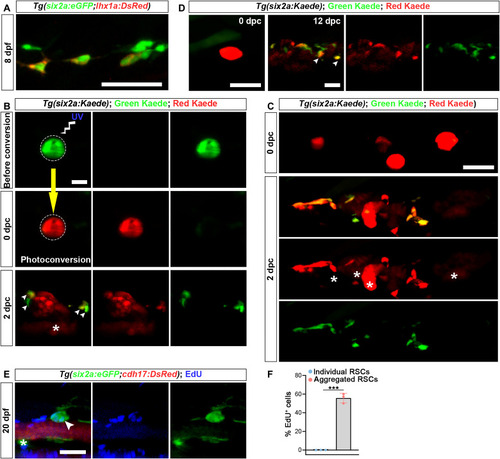
Renewal of RSCs. (A) Confocal images of Tg(six2a:eGFP;lhx1a:DsRed) zebrafish at 8 dpf show that six2a:eGFP+ RSCs begin to express lhx1a at this stage. (B) Confocal images showing six2a:Kaede+ RSC aggregate before and after photoconversion. Only the circled area was photoconverted. The asterisk indicates red Kaede+ nascent nephrons, while arrowheads indicate nascent RSCs. dpc, days postphotoconversion. (C) In individuals where all RSCs that had formed aggregates were photoconverted, nascent RSCs exhibited red fluorescence at 2 dpc. Asterisks indicate red Kaede+ nascent nephrons. (D) Long-term photoconversion-based lineage tracing revealed that nascent RSCs were capable of forming cell aggregates in newly formed nephrons at 12 dpc. Arrowheads indicate newly formed RSC aggregates. (E) EdU assay of Tg(six2a:eGFP;cdh17:DsRed) zebrafish at 20 dpf. EdU incorporation is primarily observed in RSC aggregate (arrowhead) rather than in individual RSCs (asterisk). (F) Quantification of EdU+ RSCs from (E), showing the proportion of EdU+ cells within aggregates or as individual RSCs. n = 3 fish, with 30 cells analyzed per group within each fish. Scale bars, 50 μm [(A) to (E)].
|