IMAGE

Fig. 4.

ID
ZDB-IMAGE-250828-158
Source
Figures for Yu et al., 2025
Image
Figure Caption

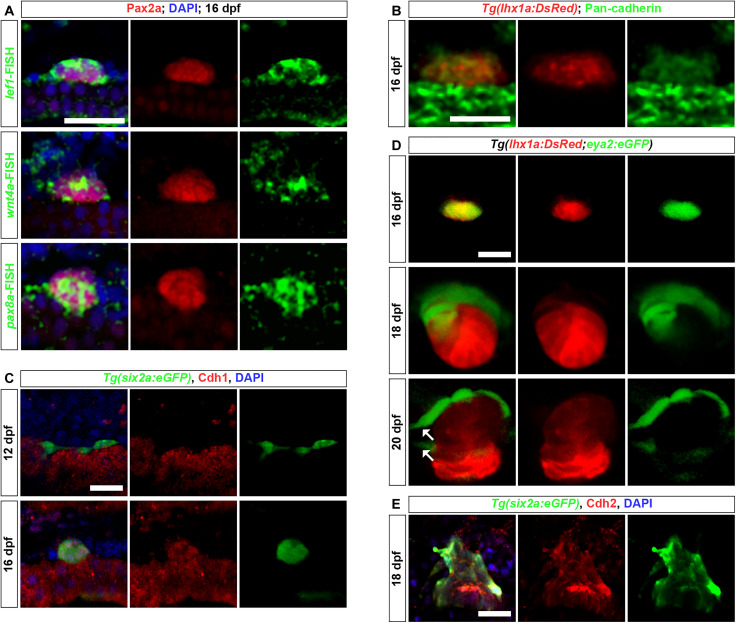
Fig. 4. MET and EMT processes during RSC renewal.

(A) The combination of lef1, wnt4a, and pax8 FISH with Pax2a immunofluorescence shows high expression of lef1, wnt4a, and pax8 in Pax2a+ RSC aggregates at 16 dpf. (B) Pan-cadherin immunofluorescence in Tg(lhx1a:DsRed) zebrafish at 16 dpf indicates that RSCs begin to establish cell junctions after aggregation. (C) Cdh1 immunofluorescence in Tg(six2a:eGFP) zebrafish shows that RSC aggregates begin to express the MET marker Cdh1 after aggregation. (D) Confocal images of Tg(lhx1a:DsRed;eya2:eGFP) zebrafish at 16, 18, and 20 dpf. Arrows indicate newly formed individual RSCs. (E) Cdh2 immunofluorescence in Tg(six2a:eGFP) zebrafish shows that RSC aggregates highly express the EMT marker Cdh2 during the generation of new RSCs. Scale bars, 50 μm [(A) to (E)]. DAPI, 4′,6-diamidino-2-phenylindole.

Acknowledgments
This image is the copyrighted work of the attributed author or publisher, and ZFIN has permission only to display this image to its users. Additional permissions should be obtained from the applicable author or publisher of the image. Full text @ Sci Adv