IMAGE

Fig. 6.

ID
ZDB-IMAGE-250828-160
Source
Figures for Yu et al., 2025
Image
Figure Caption

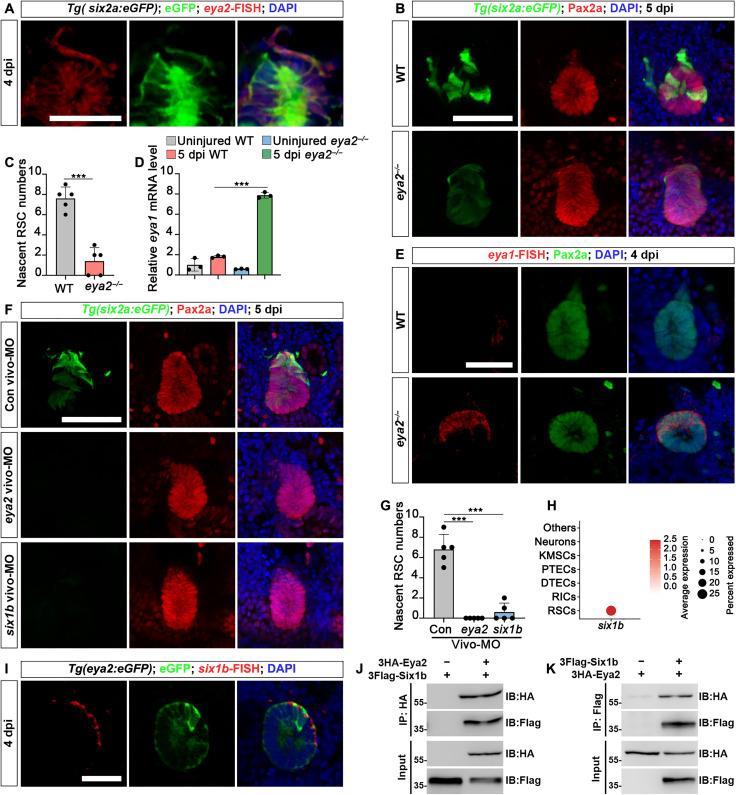
Fig. 6. Eya2-Six1b complex regulates RSC renewal.

(A) Combination of eya2-FISH and GFP immunofluorescence in Tg(six2a:eGFP) zebrafish at 4 dpi. (B) Confocal images of Pax2a immunofluorescence in Tg(eya2:eGFP) kidney sections show a significant reduction of nascent RSCs in eya2−/− kidneys compared to WT at 5 dpi. (C) Quantification of nascent six2a:eGFP+ RSCs in WT and eya2−/− zebrafish kidney sections from (A). n = 5 cell aggregates for both groups. (D) qRT-PCR analysis of eya1 expression in WT and eya2−/− zebrafish kidneys, both uninjured and at 5 dpi. The data are presented as fold changes relative to eya1 levels in the uninjured WT. (E) Combination of eya1 FISH and Pax2a immunofluorescence in eya2−/− zebrafish at 4 dpi. (F) Confocal images of adult Tg(six2a:eGFP) kidneys at 5 dpi following administration of control vivo-MO, eya2 vivo-MO, or six1b vivo-MO at −1, 2, and 4 dpi. (G) Quantification of the number of six2a:eGFP+ RSCs around cell aggregates in (F). n = 5 cell aggregates for all groups. (H) Dot plot showing the relative expression of six1b in different kidney cell types. (I) At 4 dpi, six1b FISH in Tg(eya2:eGFP) kidneys demonstrated the coexpression of eya2 and six1b in RSCs. (J and K) Coimmunoprecipitation assay demonstrating the interaction between Eya2 and Six1b. 3HA-Eya2 and 3Flag-Six1b were coexpressed in HEK293T cells. The data in [(C), (D), and (G)] were analyzed using a two-sided t test and are presented as mean values ± SD. ***P < 0.001. Scale bars, 100 μm [(A) to (I)]. IB, immunoblotting.

Acknowledgments
This image is the copyrighted work of the attributed author or publisher, and ZFIN has permission only to display this image to its users. Additional permissions should be obtained from the applicable author or publisher of the image. Full text @ Sci Adv