IMAGE

Fig. 3.

ID
ZDB-IMAGE-250828-156
Source
Figures for Yu et al., 2025
Image
Figure Caption

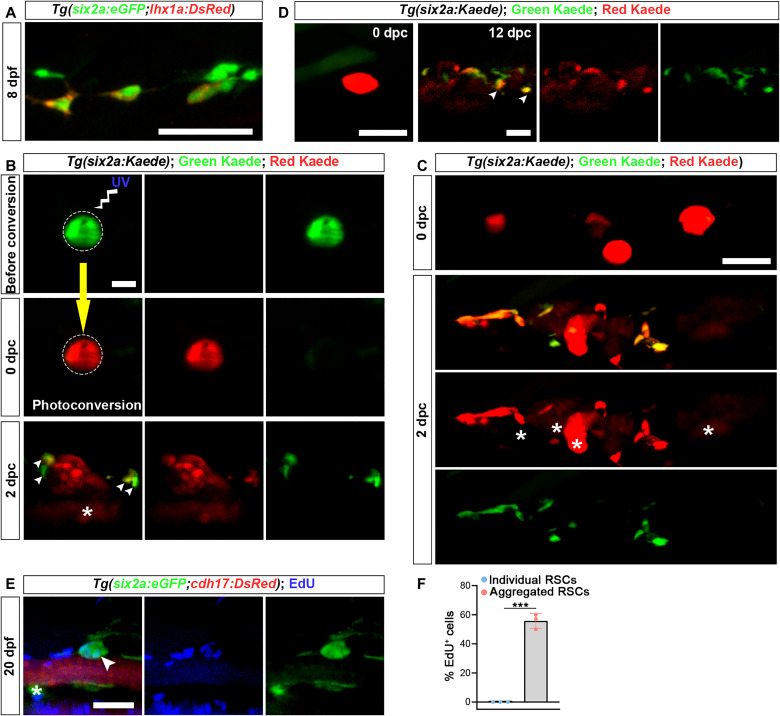
Fig. 3. Renewal of RSCs.

(A) Confocal images of Tg(six2a:eGFP;lhx1a:DsRed) zebrafish at 8 dpf show that six2a:eGFP+ RSCs begin to express lhx1a at this stage. (B) Confocal images showing six2a:Kaede+ RSC aggregate before and after photoconversion. Only the circled area was photoconverted. The asterisk indicates red Kaede+ nascent nephrons, while arrowheads indicate nascent RSCs. dpc, days postphotoconversion. (C) In individuals where all RSCs that had formed aggregates were photoconverted, nascent RSCs exhibited red fluorescence at 2 dpc. Asterisks indicate red Kaede+ nascent nephrons. (D) Long-term photoconversion-based lineage tracing revealed that nascent RSCs were capable of forming cell aggregates in newly formed nephrons at 12 dpc. Arrowheads indicate newly formed RSC aggregates. (E) EdU assay of Tg(six2a:eGFP;cdh17:DsRed) zebrafish at 20 dpf. EdU incorporation is primarily observed in RSC aggregate (arrowhead) rather than in individual RSCs (asterisk). (F) Quantification of EdU+ RSCs from (E), showing the proportion of EdU+ cells within aggregates or as individual RSCs. n = 3 fish, with 30 cells analyzed per group within each fish. Scale bars, 50 μm [(A) to (E)].

Acknowledgments
This image is the copyrighted work of the attributed author or publisher, and ZFIN has permission only to display this image to its users. Additional permissions should be obtained from the applicable author or publisher of the image. Full text @ Sci Adv