IMAGE

Fig. 1.

ID
ZDB-IMAGE-250828-153
Source
Figures for Yu et al., 2025
Image
Figure Caption

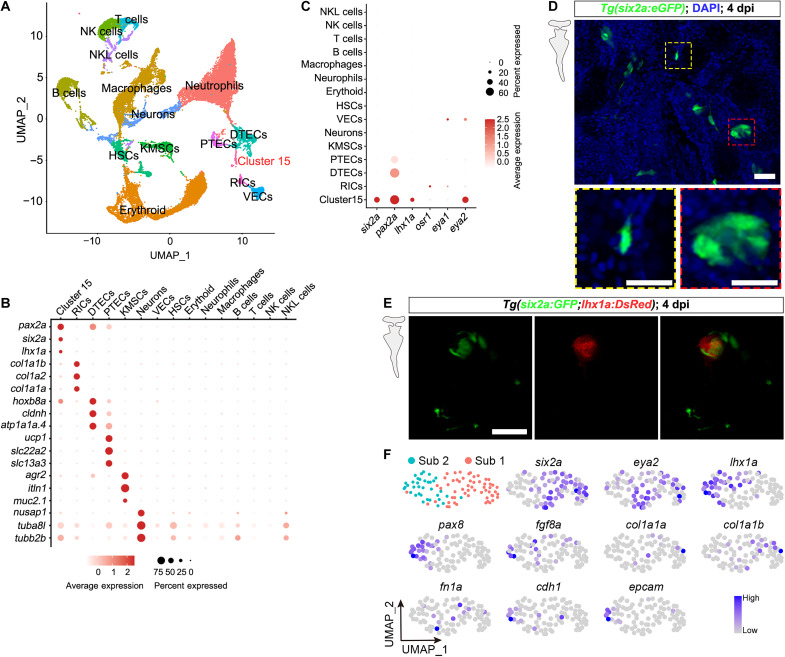
Fig. 1. Identification of potential zebrafish RSC clusters via scRNA-seq analysis of injured kidneys.

(A) Uniform Manifold Approximation and Projection (UMAP) plot analysis identified a previously undefined cell cluster (cluster 15) in the zebrafish kidney. (B) Dot plot displaying the relative expression of markers for various kidney cell clusters. Cluster 15 expresses markers associated with mammalian RPCs. (C) Dot plot showing the relative expression of six2a, pax2a, lhx1a, osr1, eya1, and eya2 across kidney cell clusters. All these genes, except eya1 and osr1, are highly expressed in cluster 15. (D) Confocal image of adult Tg(six2a:eGFP) kidneys at 4 dpi. The red dashed box outlines a cell aggregate, while the yellow dashed box highlights a dendritically shaped mesenchymal cell. The grayscale image on the left indicates that the image was captured in the adult kidney. (E) Confocal images of adult Tg(six2a:eGFP;lhx1a:DsRed) kidneys at 4 dpi, showing numerous six2a+ cells that are not labeled by lhx1a. (F) UMAP plot showing the identification of RSC subtypes following subclustering of cluster 15 from (A). UMAP feature plots indicate that subpopulation 1 exhibits high expression of six2a, eya2, col1a1a, col1a1b, and fn1a, whereas subpopulation 2 is characterized by high expression of lhx1a, pax8, fgf8a, cdh1, and epcam. NK, natural killer; VECs, vascular endothelial cells; DTECs, distal tubular epithelial cells; HSCs, hematopoietic stem cells; KMSCs, kidney mucin–secreting cells; RICs, renal interstitial cells. Scale bars, 50 μm [(D) and (E)]. PTECs, proximal tubular epithelial cells; NKL, natural killer T-like cells.

Acknowledgments
This image is the copyrighted work of the attributed author or publisher, and ZFIN has permission only to display this image to its users. Additional permissions should be obtained from the applicable author or publisher of the image. Full text @ Sci Adv