
- Title
-
Polypharmacology translates between species and phylogenetic distance: A functional, bioinformatic, and structural study on organic anion transporting polypeptides
- Authors
- Stefan, K., Namasivayam, V., Akhter, M.T., Gyimesi, G., Rafehi, M., Busch, H., Trombik, T., Luckenbach, T., König, J., Stefan, S.M.
- Source
- Full text @ Biochem. Pharmacol.
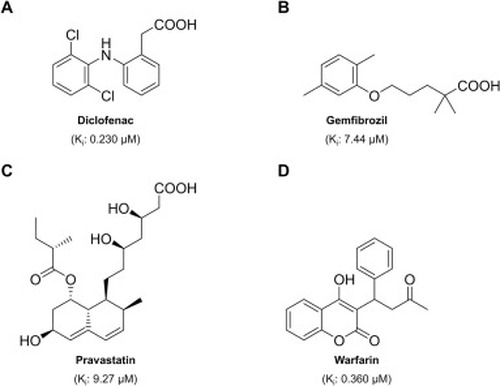
Drugs that were demonstrated to inhibit drOatp1d1 with comparably high potencies (Ki < 10 µM): diclofenac (A) [7,8], gemfibrozil (B) [8,14], pravastatin (C) [14], warfarin (D) [14]. |
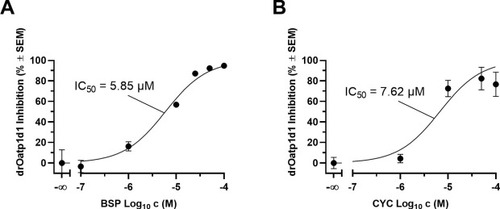
Concentration-effect curves of the model drOatp1d1 substrate bromosulfophthaleine (BSP; A) [14] and the newly established drOatp1d1 inhibitor cyclosporine A (CYC; B) [14] determined in a cell-based functional assay using radiolabeled [3H]BSP and stably transfected HEK-drOatp1d1 cells and respective HEK-Co cells [7]. Shown is mean ± standard error of the mean (SEM) of at least four independent experiments. |
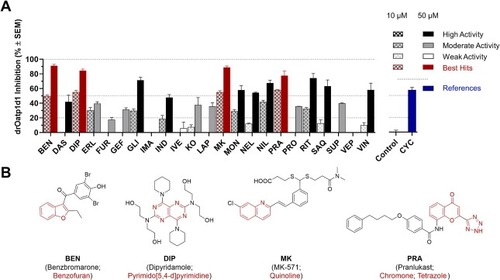
Initial screening of the high-quality compound collection of 23 pan-ABC transporter modulators against drOatp1d1 (A) applying a cell-based functional assay using radiolabeled [3H]BSP and stably transfected HEK-drOatp1d1 and HEK-Co cells [7]. Net uptake was calculated by subtracting the uptake into HEK-Co cells from the uptake into HEK-drOatp1d1 cells and data are given in relation to the net uptake without added substance (0 % inhibition). Inhibition of BSP uptake into HEK-Co cells and HEK-drOatp1d1 cells by the newly established drOatp1d1 transport inhibitor cyclosporine A (CYC; 5 µM; blue) is shown as reference [14]. The effect values of the 23 drugs and drug-like compounds at 10 µM (patterned bars) and 50 µM (filled bars) were categorized according to their high [effect value ≥ 50 % (+SEM); black], moderate [effect value ≥ 20 % (+SEM); gray], and weak [effect value < 20 % (+SEM); white] activity. Red annotation: Benzbromarone (BEN), dipyridamole (DIP), MK-571 (MK), and pranlukast (PRA) were identified as the most potent hit compounds even exceeding the inhibitory power of CYC on drOatp1d1-mediated transport, and their molecular formulae are provided with highlighted basic scaffolds (red; B). Shown are mean ± SEM values of at least four independent experiments. (For interpretation of the references to color in this figure legend, the reader is referred to the web version of this article.) |
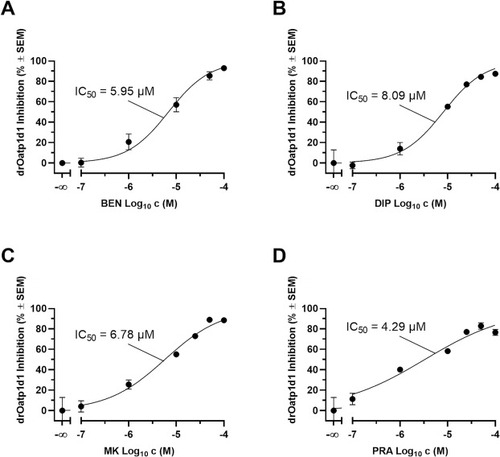
Concentration-effect curves of benzbromarone (BEN; IC50: 5.95 µM ± 1.49 µM; A), dipyridamole (DIP; IC50: 8.09 µM ± 0.28 µM; B), MK-571 (MK; IC50: 6.78 µM ± 0.39 µM; C), and pranlukast (PRA; IC50: 4.29 µM ± 0.60 µM; D) against drOatp1d1 applying a cell-based functional assay using radiolabeled [3H]BSP and stably transfected HEK-drOatp1d1 cells and the respective HEK-Co cells [7]. Shown is mean ± SEM of at least four independent experiments. |
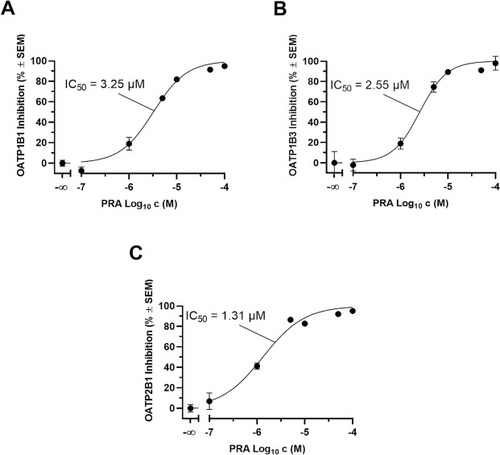
Concentration-dependent inhibition of OATP1B1, OATP1B3, and OATP2B1-mediated transport by PRA determined in a cell-based functional assay using radiolabeled [3H]BSP and stably transfected HEK-OATP1B1 (IC50: 3.25 µM ± 0.09 µM; A), HEK-OATP1B3 (IC50: 2.55 µM ± 0.21 µM; B), and HEK-OATP2B1 (IC50: 1.31 µM ± 0.06 µM; C) as well as respective HEK-Co cells. IC50 values were calculated based on net uptake values (uptake into HEK-Co cells subtracted from the uptake into HEK-transporter-expressing cells) and the net uptake without PRA was set to 0 % uptake inhibition. Shown is mean ± SEM of at least four independent experiments. |
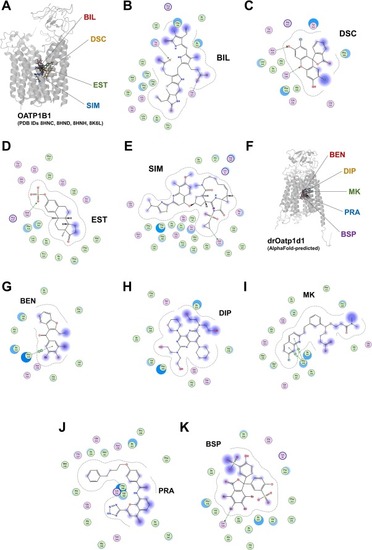
Structural analyses of human OATP1B1 (PDB IDs 8HNC, 8HND, 8HNH, and 8K6L) and colocalized ligands (A), i.e., bilirubin (BIL; B), 2′,7′-dichlorofluorescein (DCF; C), the pan-SLC transporter modulator estrone sulfate (EST; D), and simeprevir (SIM; E). Additionally shown is the AlphaFold 3-generated [43] structure of drOatp1d1 (UniProt entry A0A8M9PU70; F) with blindly-docked molecules, i.e., BEN (G), DIP (H), MK (I), PRA (J), and BSP (K). |
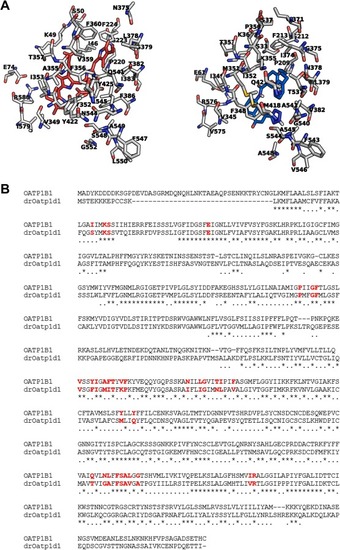
Structural comparison of the binding pockets of human OATP1B1 and drOatp1d1. A The protein backbones are shown in white (nitrogens: blue; oxygens: red; sulfurs: yellow), with key binding site residues labeled; left: BIL (red); right: PRA (blue). B Sequence alignment between human OATP1B1 (UniProt entry Q9Y6L6) and drOatp1d1 (UniProt entry A0A8M9PU70). The residues in the binding pocket highlighted in red, indicating conserved key residues involved in ligand interaction and transport function. (For interpretation of the references to color in this figure legend, the reader is referred to the web version of this article.) |
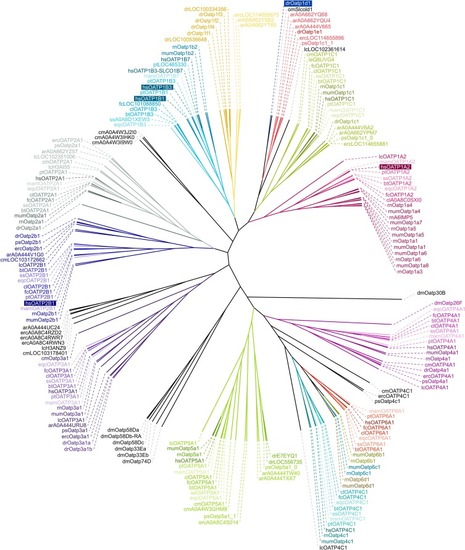
Phylogenetic tree of OATPs of typical mammals, clinically relevant species, and members from four clades of bony and cartilaginous fish based on protein sequences retrieved from UniProt (https://www.uniprot.org). Abbreviations (alphabetically sorted): ar – Acipenser ruthenus (starlet); bt – Bos taurus (cattle); cl – Canis lupus (wolf); cm – Callorhinchus milii (Australian ghostshark); dm – Drosophila melanogaster (fruitfly); dr – Danio rerio (zebrafish); ec – Equus caballus (horse); fc – Felis catus (cat); hs − Homo sapiens (human); lc – Latimeria chalumnae (west Indian ocean coelacanth); mam – Macaca mulatta (rhesus macaque); mum – Mus musculus (house mouse); pt – Pan troglodytes (chimpanzee); rn – Rattus norvegicus (brown rat); ss – Sus scrofa (wild boar). |
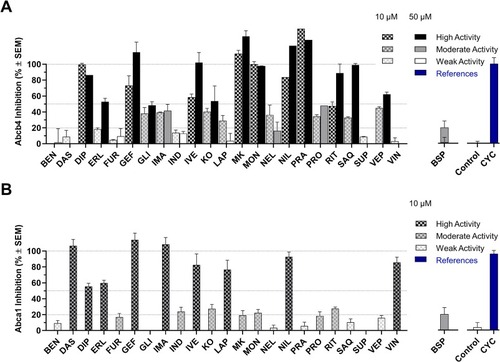
Functional analyses of the 23 pan-ABC transporter modulators against drAbcb4 [39] (A) and murine Abca1 [40,41] (B) determined in rhodamine B and 25-NBD-cholesterol assays, respectively, in zebrafish embryos and murine J774A.1 macrophages, respectively. The compounds were tested at 10 µM (patterned bars) and 50 µM (filled bars) and highly [effect value ≥ 50 % (+SEM); black], moderately [effect value ≥ 20 % (+SEM); gray], and weakly [effect value < 20 % (+SEM); white] active compounds were annotated. Negative (control; white) and positive [CYC, 40 µM (A) and 10 µM (B); blue] responses are shown. Shown are the mean ± SEM values of at least two independent experiments. (For interpretation of the references to color in this figure legend, the reader is referred to the web version of this article.) |