
Image
|
Figure Caption
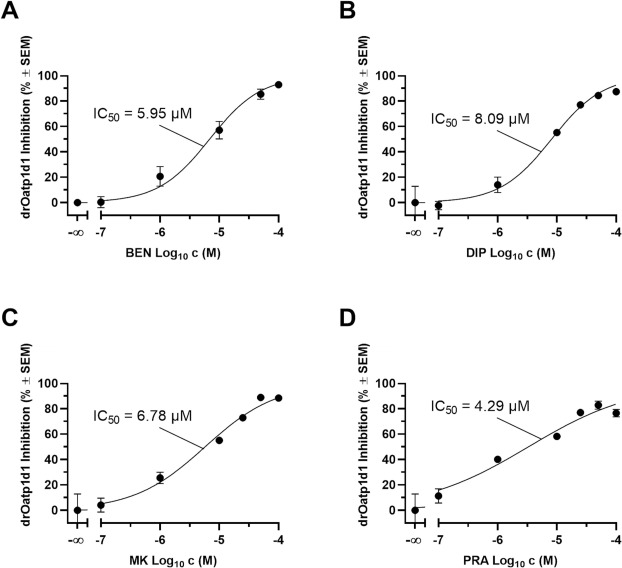
Fig. 4 Concentration-effect curves of benzbromarone (BEN; IC50: 5.95 µM ± 1.49 µM; A), dipyridamole (DIP; IC50: 8.09 µM ± 0.28 µM; B), MK-571 (MK; IC50: 6.78 µM ± 0.39 µM; C), and pranlukast (PRA; IC50: 4.29 µM ± 0.60 µM; D) against drOatp1d1 applying a cell-based functional assay using radiolabeled [3H]BSP and stably transfected HEK-drOatp1d1 cells and the respective HEK-Co cells [7]. Shown is mean ± SEM of at least four independent experiments.
Acknowledgments
This image is the copyrighted work of the attributed author or publisher, and
ZFIN has permission only to display this image to its users.
Additional permissions should be obtained from the applicable author or publisher of the image.
Full text @ Biochem. Pharmacol.