
|
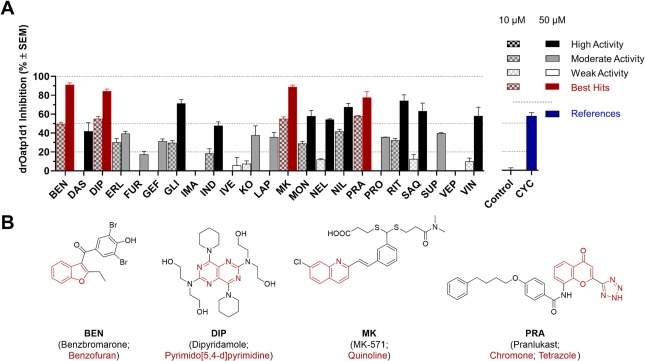
Fig. 3 Initial screening of the high-quality compound collection of 23 pan-ABC transporter modulators against drOatp1d1 (A) applying a cell-based functional assay using radiolabeled [3H]BSP and stably transfected HEK-drOatp1d1 and HEK-Co cells [7]. Net uptake was calculated by subtracting the uptake into HEK-Co cells from the uptake into HEK-drOatp1d1 cells and data are given in relation to the net uptake without added substance (0 % inhibition). Inhibition of BSP uptake into HEK-Co cells and HEK-drOatp1d1 cells by the newly established drOatp1d1 transport inhibitor cyclosporine A (CYC; 5 µM; blue) is shown as reference [14]. The effect values of the 23 drugs and drug-like compounds at 10 µM (patterned bars) and 50 µM (filled bars) were categorized according to their high [effect value ≥ 50 % (+SEM); black], moderate [effect value ≥ 20 % (+SEM); gray], and weak [effect value < 20 % (+SEM); white] activity. Red annotation: Benzbromarone (BEN), dipyridamole (DIP), MK-571 (MK), and pranlukast (PRA) were identified as the most potent hit compounds even exceeding the inhibitory power of CYC on drOatp1d1-mediated transport, and their molecular formulae are provided with highlighted basic scaffolds (red; B). Shown are mean ± SEM values of at least four independent experiments. (For interpretation of the references to color in this figure legend, the reader is referred to the web version of this article.)