
- Title
-
Discovery of novel butyrylcholinesterase inhibitors for treating Alzheimer's disease
- Authors
- Sang, Z., Huang, S., Tan, W., Ban, Y., Wang, K., Fan, Y., Chen, H., Zhang, Q., Liang, C., Mi, J., Gao, Y., Zhang, Y., Liu, W., Wang, J., Dong, W., Tan, Z., Tang, L., Luo, H.
- Source
- Full text @ Acta Pharm Sin B
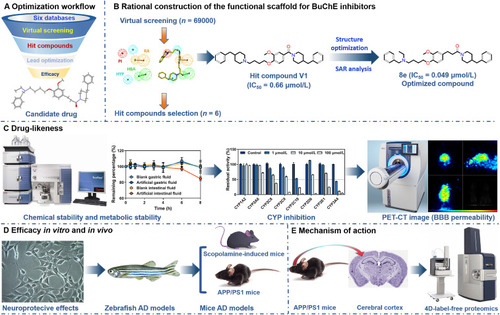
Schematic illustration of rational design of selective BuChE inhibitor for treating AD. |
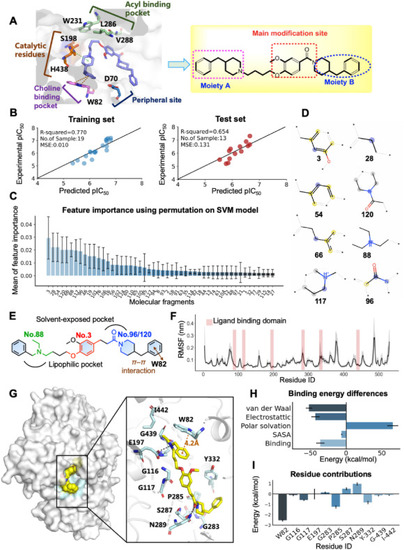
Computational chemistry revealed the binding modes of 8e. (A) Key residues of human BuChE (PDB code: 4TPK) and modification strategy for derivative design based on hit compound V1 structure. (B) The performance of the optimal QSAR model on the training and test dataset. Experimental vs. predicted –log10 (IC50) of the 19 training (left) and 13 test (right) samples. (C) Key molecular fragments derived from permutation feature importance. (D) Chemical structures of the top 8 fragments. (E) Key molecular fingerprints are shown in color in a 2D schematic. (F) The root mean square fluctuation (RMSF) of protein Cα during 50 ns MD simulations. Error bars represent standard deviation of three experiments. (G) The lowest energy binding mode of 8e–BuChE complex. The compound is shown in yellow stick mode. Key residues of BuChE are depicted in cyan stick mode. The hydrogen bond and π–π interactions were represented as dark and orange dashed line, respectively. (H) Total binding free energy and its component. (I) Residue contribution of hot residues for receptor–ligand combination. |

(A) The recovery of BuChE inhibitors (donepezil, rivastigmine and 8e) inhibition after dilution with time monitoring. (B) The cell viability (%) of 8e on HT22 cells, PC12 cells and SH-SY5Y cells. (C) Neuroprotective effects of 8e and donepezil on Glu-induced HT22 cell injury. (D) Neuroprotective effects of 8e and donepezil on Aβ25–35-induced HT22 cell injury. (E) Neuroprotective effects of 8e on Aβ25–35-induced PC12 cell injury. (F) The chemical stability of 8e in artificial gastrointestinal fluid. (G) The metabolic stability of 8e in human/rat liver microsomes. (H) The CYP inhibition effects of 8e. (I) In vivo PET-CT images of [11C]8e in mice brain after intravenous administration and time–activity curve. Values are presented as mean ± SD from three independent experiments. ##P < 0.01 vs. control group; ∗P < 0.05, ∗∗P < 0.01, ∗∗∗P < 0.001 vs. model group. |

Effects of knocking down BuChE gene on the zebrafish AD model. (A) Behavioral changes in the zebrafish larvae per minute. (B–D) The swimming distance under light, dark or total conditions. (E–G) The swimming speed under light, dark or total conditions. (H, I) Reaction capacity changes during the transitions between light and dark conditions. (J) BuChE activity changes in the various zebrafish models. (K) Effects of 8e on the survival rate of zebrafish embryos. (L) Effects of 8e on morphological changes in zebrafish. Scale bar = 200 μm. (M) Pericardial edema/body length changes after treatment with 8e. (N) Swim bladder area changes. (O) Liver fluorescence area changes. (P) Fluorescence intensity changes. (Q) Effects of 8e on morphological changes in liver. Values are presented as mean ± SD from three independent experiments. Scale bar = 200 μm ∗P < 0.05, ∗∗P < 0.01, ∗∗∗P < 0.001, ∗∗∗∗P < 0.0001 vs. control group; #P < 0.05, ##P < 0.01, ###P < 0.001 vs. zebrafish AD model group. |

Effects of 8e in the BuChE-overexpression zebrafish model. (A) Behavioral changes in the zebrafish larvae per minute. (B–D) The swimming distance of 8e in the BuChE-overexpression model under light, dark or total conditions. (E–G) The swimming speed of 8e in the BuChE-overexpression model under light, dark or total conditions. (H, I) Reaction capacity changes during the transitions between light and dark conditions. (J) BuChE activity changes in the various groups. Values are presented as mean ± SD from three independent experiments. ∗∗P < 0.01, ∗∗∗P < 0.001 vs. control group; #P < 0.05, ##P < 0.01, ###P < 0.001 vs. BuChE-overexpression zebrafish group. |

Effects of 8e in the AlCl3-induced zebrafish model. (A) Behavioral changes in the zebrafish larvae per minute. (B–D) The swimming distance of 8e in the AlCl3-induced zebrafish model under light, dark or total conditions. (E–G) The swimming speed of 8e in the AlCl3-induced zebrafish model under light, dark or total conditions. (H, I) Reaction capacity changes during the transitions between light and dark conditions. (J) The apoptotic body/normal cells in the various zebrafish models were statistically analyzed after HE staining. (K) Apoptotic body changes in the brain of zebrafish were performed using HE staining. Scale bar = 10 μm. (L) BuChE activity changes in various zebrafish group. (M) ACh level changes in various zebrafish group. (N) IL-6 mRNA expression changes in various zebrafish group. (O) TNF-α mRNA expression changes in various zebrafish group. (P) IL-1β mRNA expression changes in various zebrafish group. (Q) APP mRNA expression changes in various zebrafish group. (R) PS1 mRNA expression changes in various zebrafish group. (S) APOE mRNA expression changes in various zebrafish group. Values are presented as mean ± SD from three independent experiments. ∗P < 0.05, ∗∗P < 0.01, ∗∗∗P < 0.001 vs. control group. #P < 0.05, ##P < 0.01, ###P < 0.001 vs. AlCl3-induced zebrafish model group. |

Effects of 8e on scopolamine-induced mice dysmnesia using the step-down passive avoidance task. (A) The step-down lantancy changes in various group. (B) Error times changes in various group. (C, D) Neuronal apoptosis in the hippocampus was conducted and analyzed using TUNEL staining. (E, F) The cumulative transport of 8e on the AP-BL/BL-AP side was evaluated. (G, H) The permeability of compound 8e was evaluated using the Papp values. (I) The tissue distribution of compound 8e in SD mice (220–250 g) following oral administration at a dose of 25 mg/kg at various time points. Values are presented as mean ± SD from three independent experiments. Values are presented as mean ± SD from three independent experiments. ##P < 0.01, ###P < 0.001 vs. control group; ∗∗P < 0.01, ∗∗∗P < 0.001 vs. model group. |

In vivo effects of 8e in APP/PS1 mice. (A) The learning abilities of the 6-month-old APP/PS1 mice were assessed using the MWM. (B) The escape latency changes were recorded in various groups. (C) Weight changes were recorded in various experimental groups. In the MWM assay were recorded. (D–I) The effects of 8e to evaluate spatial memory and long-term memory by observing and recording escape platform retention times, number of escape platform entries, escape platform distance, effective zone movement times, number of effective zone entries and effective zone movement distance. (J) Escape latency trace in various group. (K) Effective zone movement distance trace in various group. Values are presented as mean ± SD from three independent experiments. ###P < 0.001 vs. wild-type C57BL/6 mice group; ∗P < 0.05, ∗∗P < 0.01, ∗∗∗P < 0.001 vs. APP/PS1 mice group. |

In vivo effects of 8e in the hippocampus and cerebral cortex. (A, B) The expression of the neuronal abnormalities in the hippocampus and cerebral cortex were examined using HE staining. Scale bar = 50 μm. (C, D) The expression of BuChE in the hippocampus and cerebral cortex of APP/PS1 mice were examined using Immunofluorescence staining. Scale bar = 200 μm. (E) The expression of Aβ1–42 in the cerebral cortex were performed using immunofluorescence staining. (F) BuChE activity in hippocampus and cerebral cortex were analysed using qPCR. (G–K) The levels of ACh, Aβ1–42, IL-6, TNF-α, and IL-1β in the cerebral cortex using ELISA kits were quantified. Values are presented as mean ± SD from three independent experiments. ∗P < 0.05, ∗∗P < 0.01, ∗∗∗P < 0.001 vs. APP/PS1 mice group; #P < 0.05, ##P < 0.01, ###P < 0.001 vs. wild-type C57BL/6 mice group. |

The differentially expressed proteins were visualized through Volcano. (A) Compared with control group, the model group exhibited an upregulation of 104 proteins and a downregulation of 130 proteins; (B) 91 proteins were found to be upregulated and 135 downregulated between the 8e and control group; (C) 131 proteins were upregulated while 122 proteins were downregulated in comparison to the model group; (D–N) Plots Cluster analysis of all proteins based on their expression level change patterns using Mfuzz and hierarchical clustering. |

The mechanism of action of 8e. (A–G) The expression of identified differentially expressed proteins (Pfdn1, Ace, Dao, Vldlr, Yes1, Arg1, and Pdk1) closely related to the progression of AD. (H) The expressions of pfdn1 and VLDLR in cerebral cortex were determined by qPCR. (I) The expressions of pfdn1 and VLDLR in cerebral cortex were detected by Western blot. (J) The schematic diagram of the possible mechanism of action for compound 8e. Values are presented as mean ± SD from three independent experiments. #P < 0.05, ##P < 0.01, ###P < 0.001 vs. control group; ∗P < 0.05, ∗∗∗P < 0.001, ∗∗∗∗P < 0.0001 vs. model group. |