
Image
|
Figure Caption
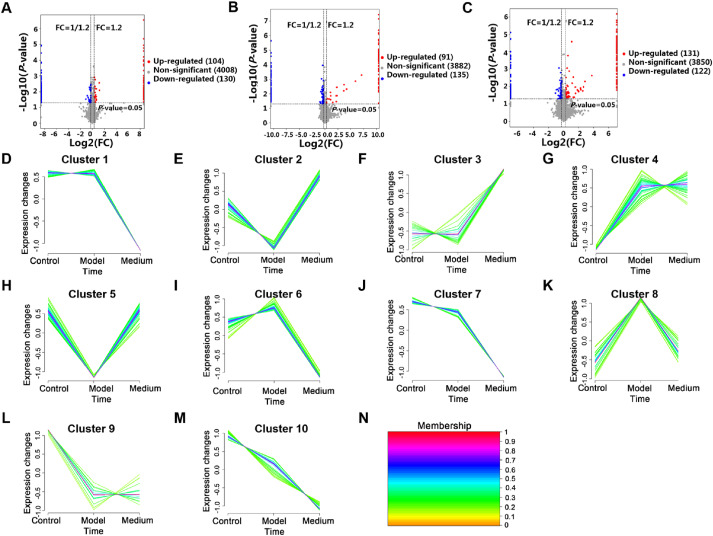
Fig. 10 The differentially expressed proteins were visualized through Volcano. (A) Compared with control group, the model group exhibited an upregulation of 104 proteins and a downregulation of 130 proteins; (B) 91 proteins were found to be upregulated and 135 downregulated between the 8e and control group; (C) 131 proteins were upregulated while 122 proteins were downregulated in comparison to the model group; (D–N) Plots Cluster analysis of all proteins based on their expression level change patterns using Mfuzz and hierarchical clustering.
Acknowledgments
This image is the copyrighted work of the attributed author or publisher, and
ZFIN has permission only to display this image to its users.
Additional permissions should be obtained from the applicable author or publisher of the image.
Full text @ Acta Pharm Sin B