
|
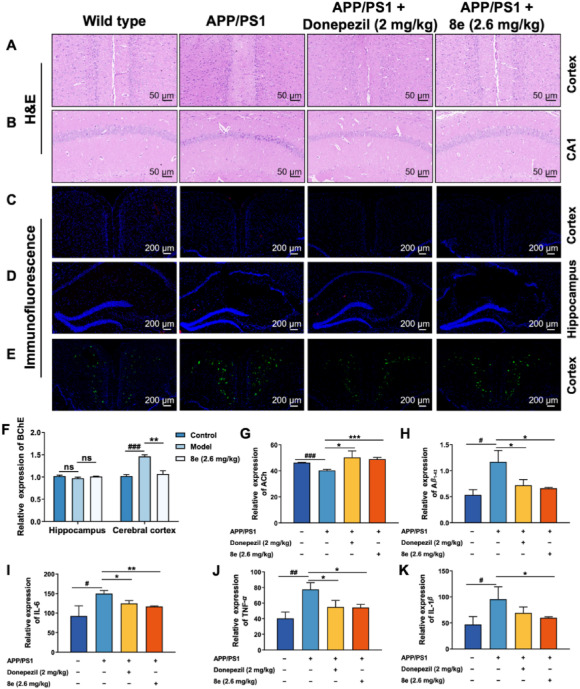
Fig. 9 In vivo effects of 8e in the hippocampus and cerebral cortex. (A, B) The expression of the neuronal abnormalities in the hippocampus and cerebral cortex were examined using HE staining. Scale bar = 50 μm. (C, D) The expression of BuChE in the hippocampus and cerebral cortex of APP/PS1 mice were examined using Immunofluorescence staining. Scale bar = 200 μm. (E) The expression of Aβ1–42 in the cerebral cortex were performed using immunofluorescence staining. (F) BuChE activity in hippocampus and cerebral cortex were analysed using qPCR. (G–K) The levels of ACh, Aβ1–42, IL-6, TNF-α, and IL-1β in the cerebral cortex using ELISA kits were quantified. Values are presented as mean ± SD from three independent experiments. ∗P < 0.05, ∗∗P < 0.01, ∗∗∗P < 0.001 vs. APP/PS1 mice group; #P < 0.05, ##P < 0.01, ###P < 0.001 vs. wild-type C57BL/6 mice group.