
|
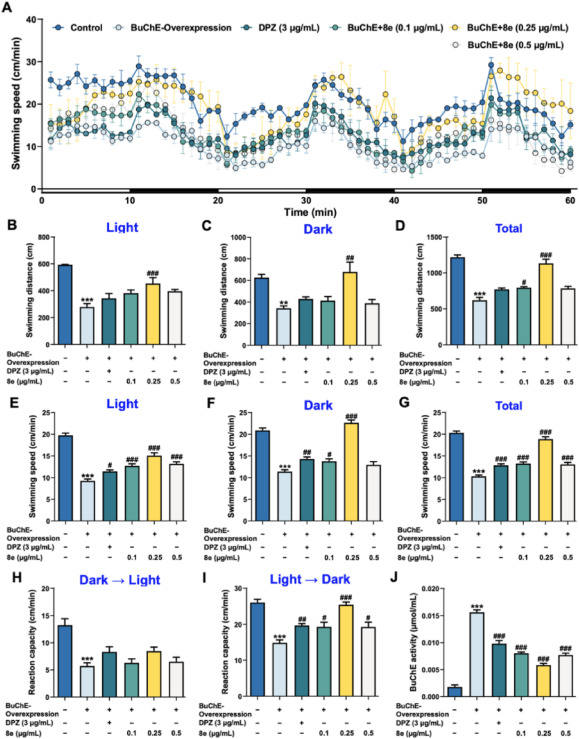
Fig. 5 Effects of 8e in the BuChE-overexpression zebrafish model. (A) Behavioral changes in the zebrafish larvae per minute. (B–D) The swimming distance of 8e in the BuChE-overexpression model under light, dark or total conditions. (E–G) The swimming speed of 8e in the BuChE-overexpression model under light, dark or total conditions. (H, I) Reaction capacity changes during the transitions between light and dark conditions. (J) BuChE activity changes in the various groups. Values are presented as mean ± SD from three independent experiments. ∗∗P < 0.01, ∗∗∗P < 0.001 vs. control group; #P < 0.05, ##P < 0.01, ###P < 0.001 vs. BuChE-overexpression zebrafish group.