
|
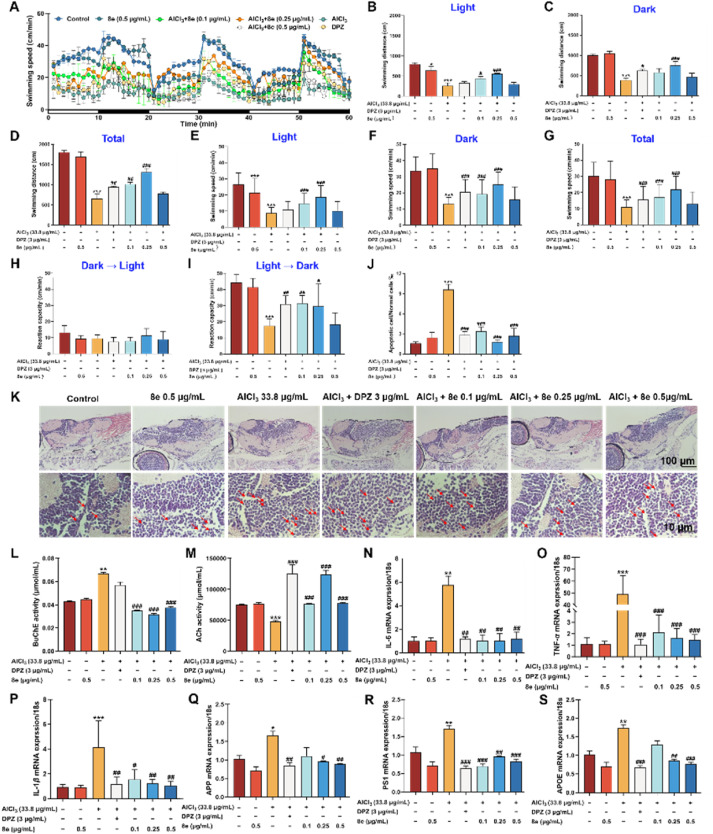
Fig. 6 Effects of 8e in the AlCl3-induced zebrafish model. (A) Behavioral changes in the zebrafish larvae per minute. (B–D) The swimming distance of 8e in the AlCl3-induced zebrafish model under light, dark or total conditions. (E–G) The swimming speed of 8e in the AlCl3-induced zebrafish model under light, dark or total conditions. (H, I) Reaction capacity changes during the transitions between light and dark conditions. (J) The apoptotic body/normal cells in the various zebrafish models were statistically analyzed after HE staining. (K) Apoptotic body changes in the brain of zebrafish were performed using HE staining. Scale bar = 10 μm. (L) BuChE activity changes in various zebrafish group. (M) ACh level changes in various zebrafish group. (N) IL-6 mRNA expression changes in various zebrafish group. (O) TNF-α mRNA expression changes in various zebrafish group. (P) IL-1β mRNA expression changes in various zebrafish group. (Q) APP mRNA expression changes in various zebrafish group. (R) PS1 mRNA expression changes in various zebrafish group. (S) APOE mRNA expression changes in various zebrafish group. Values are presented as mean ± SD from three independent experiments. ∗P < 0.05, ∗∗P < 0.01, ∗∗∗P < 0.001 vs. control group. #P < 0.05, ##P < 0.01, ###P < 0.001 vs. AlCl3-induced zebrafish model group.