
|
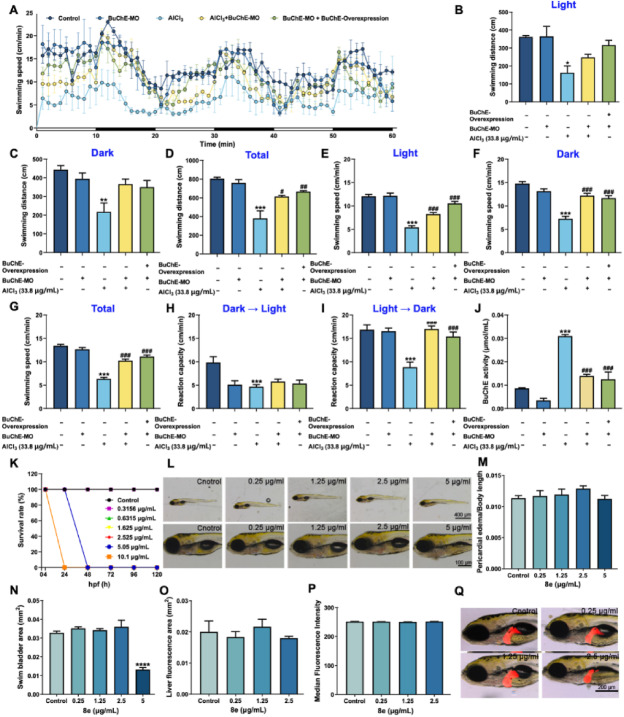
Fig. 4 Effects of knocking down BuChE gene on the zebrafish AD model. (A) Behavioral changes in the zebrafish larvae per minute. (B–D) The swimming distance under light, dark or total conditions. (E–G) The swimming speed under light, dark or total conditions. (H, I) Reaction capacity changes during the transitions between light and dark conditions. (J) BuChE activity changes in the various zebrafish models. (K) Effects of 8e on the survival rate of zebrafish embryos. (L) Effects of 8e on morphological changes in zebrafish. Scale bar = 200 μm. (M) Pericardial edema/body length changes after treatment with 8e. (N) Swim bladder area changes. (O) Liver fluorescence area changes. (P) Fluorescence intensity changes. (Q) Effects of 8e on morphological changes in liver. Values are presented as mean ± SD from three independent experiments. Scale bar = 200 μm ∗P < 0.05, ∗∗P < 0.01, ∗∗∗P < 0.001, ∗∗∗∗P < 0.0001 vs. control group; #P < 0.05, ##P < 0.01, ###P < 0.001 vs. zebrafish AD model group.