FIGURE SUMMARY
Title

Purine metabolism rewiring improves glioblastoma susceptibility to temozolomide treatment

Authors
D'Aprile, S., Denaro, S., Torrisi, F., Longhitano, L., Giallongo, S., Giallongo, C., Bontempi, V., Bucolo, C., Drago, F., Mione, M.C., Li Volti, G., Potokar, M., Jorgačevski, J., Zorec, R., Tibullo, D., Amorini, A.M., Vicario, N., Parenti, R.
Source
Full text @ Cell Death Dis.

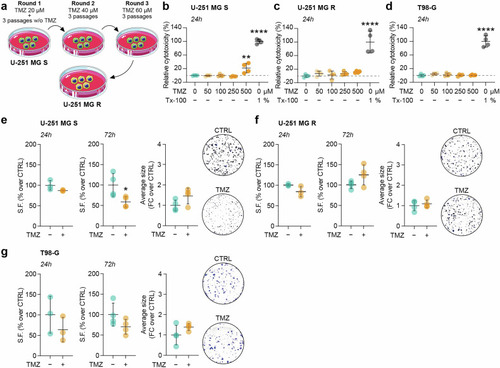
U-251 MG S, U-251 MG R and T98-G cells differently tolerate TMZ.

a Schematic representation of the protocol used to induce TMZ resistance in U-251 MG S cells. bd LDH assay at 24 h on U-251 MG S (b), U-251 MG R (c) and T98-G (d) cells treated with 0, 50, 100, 250, 500 μM of TMZ. eg Surviving fraction (SF) at 24 h and 72 h post-treatment, quantification of average clones size and representative pictures of the clonogenic assay at 72 h of U-251 MG S (e), U-251 MG R (f) and T98-G (g) clonogenic assay. Data are shown via scattered dot plots as mean ± SD of n ≥ 3 independent experiments. *p-value < 0.05; **p-value < 0.01; **** p-value < 0.0001. CTRL control, FC fold change, SF surviving fraction, TMZ temozolomide, Tx-100 Triton X-100.

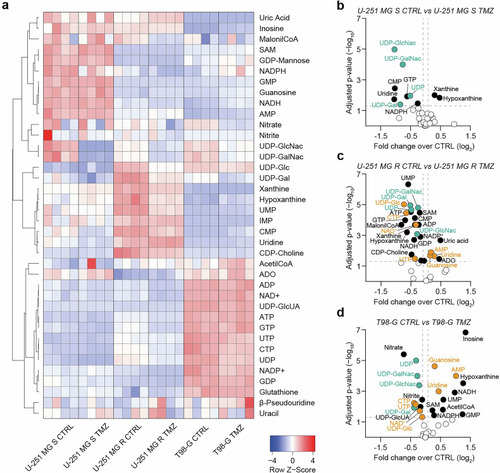
Sensitive and resistant GBM cells display distinct metabolic profiles.

a Heatmap of Z-Score values based on the abundance of 38 metabolites. bd Volcano plots of metabolites levels expressed as log2 fold changes over CTRL and −log10 of adjusted p-value in U-251 MG S CTRL versus TMZ-treated (b), U-251 MG R CTRL versus TMZ-treated (c), T98-G CTRL versus TMZ-treated (d). White dots represent not significantly modulated metabolites; black dots represent significantly modulated metabolites; green dots represent metabolites showing the same trend in all tested cell lines; orange dots represent metabolites showing the same trend in resistant cell lines (i.e. U-251 MG R and T98-G). Data include n = 4 independent replicates per group. CTRL control, TMZ temozolomide.

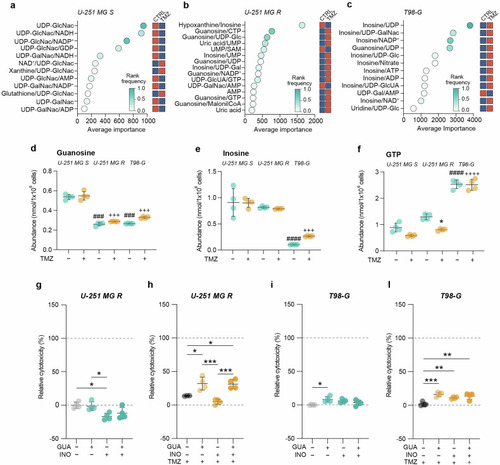
Guanosine and inosine are involved in TMZ resistance.

ac Metabolite ratio analysis plots, representing ratios with higher average importance for U-251 MG S (a), U-251 MG R (b) and T98-G (c). Blue squares indicate lower levels or ratios between metabolites and red squares indicate higher levels or ratios between metabolites in CTRL vs TMZ. d Guanosine abundance (expressed as nmol/1 × 106 cells) in CTRL versus TMZ-treated cells for U-251 MG S, U-251 MG R and T98-G. e Inosine abundance (expressed as nmol/1 × 106 cells) in CTRL versus TMZ-treated cells for U-251 MG S, U-251 MG R and T98-G. f GTP abundance (expressed as nmol/1 × 106 cells) in CTRL versus TMZ-treated cells for U-251 MG S, U-251 MG R and T98-G. Data are shown via scattered dot plots as mean ± SD of n = 4 independent experiments. g LDH assay at 24 h on U-251 MG R, CTRL or treated with guanosine and/or inosine. h LDH assay at 24 h on U-251 MG R, treated with TMZ and/or guanosine/inosine. i LDH assay at 24 h on T98-G, CTRL or treated with guanosine and/or inosine. l LDH assay at 24 h on T98-G, treated with TMZ and/or guanosine/inosine. Data are shown via scattered dot plots as mean ± SD of n ≥ 3 independent experiments. *p-value < 0.05; **p-value < 0.01; ***p-value < 0.001 vs untreated or between groups; ###p-value < 0.001; ####p-value < 0.0001 vs untreated U-251 MG S; +++p-value < 0.001; ++++p-value < 0.0001 vs TMZ treated U-251 MG S. CTRL control, GUA guanosine, INO inosine, TMZ temozolomide.

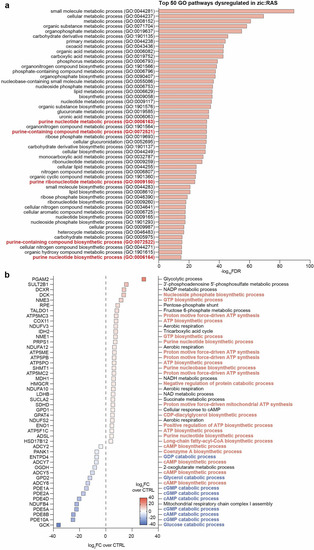
GBM zebrafish model shows increased purine biosynthesis and reduced purine catabolism.

a RNA-seq analysis of the top 50 GO pathways dysregulated in the zic:RAS zebrafish model. Data are shown as −log10 of FDR. b Summary plot of genes involved in purine dysregulated pathways showed in (a) with the description of their functions. In red are represented functions correlated with biosynthetic processes and in blue functions correlated with catabolic processes. Squares are key-coloured according to their log2 FC over CTRL. CTRL control, FC fold change, FDR false discovery rate, GO gene ontology.

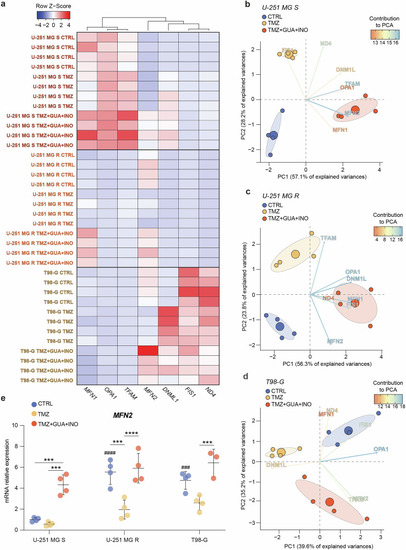
Guanosine and inosine increase MFN2 expression.

a Heatmap of Z-Score values based on mRNA relative expression of 7 genes, involved in mitochondrial fusion and fission. bd PCA biplot of 7 genes in CTRL, TMZ-treated and TMZ + GUA + INO-treated cells for U-251 MG S (b), U-251 MG R (c) and T98-G (d). Key-coloured arrows represent the contribution of each variable to the PCA; small circles are the single sample, while large circles are the mean points of the confidence ellipses. e mRNA expression levels of MFN2 in CTRL, TMZ-treated and TMZ + GUA + INO-treated cells for U-251 MG S, U-251 MG R, T98-G. Data are shown via scattered dot plots as mean ± SD of n ≥ 3 independent experiments. ***p-value < 0.001 and ****p-value < 0.0001 between groups. ###p-value < 0.001 and ####p-value < 0.0001 vs CTRL U-251 MG S. CTRL control, GUA guanosine, INO inosine, PCs principal components, PCA principal components analysis, TMZ temozolomide.

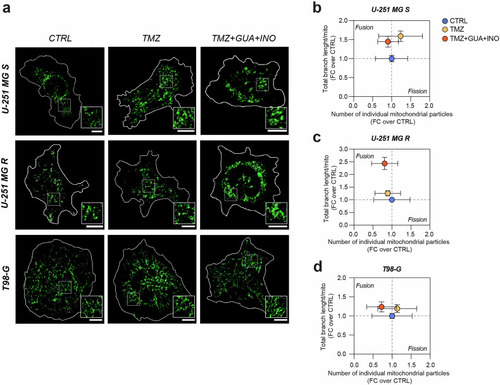
Guanosine and inosine, in combination with TMZ, stimulate mitochondrial fusion.

a Representative micrographs of MitoView staining in CTRL, TMZ-treated and TMZ + GUA + INO-treated cells for U-251 MG S, U-251 MG R, T98-G. Scale bar = 10 μm. bd Correlated quantification between total branch length/mito and number of individual mitochondrial particles in FC over CTRL for U-251 MG S (b), U-251 MG R (c) and T98- G (d). For U-251 MG S, CTRL: n = 37 cells from 4 biological replicates; TMZ: n = 33 cells from 4 biological replicates; TMZ + GUA + INO: n = 37 cells from 4 biological replicates. For U-251 MG R, CTRL: n = 26 cells from 4 biological replicates; TMZ: n = 45 cells from 4 biological replicates; TMZ + GUA + INO: n = 34 cells from 4 biological replicates. For T98-G, CTRL: n = 39 cells from 4 biological replicates; TMZ: n = 46 cells from 4 biological replicates; TMZ + GUA + INO: n = 40 cells from 4 biological replicates. Data are shown via scatter plots as mean ± SD. CTRL control, FC fold change, GUA guanosine, INO inosine, TMZ temozolomide.

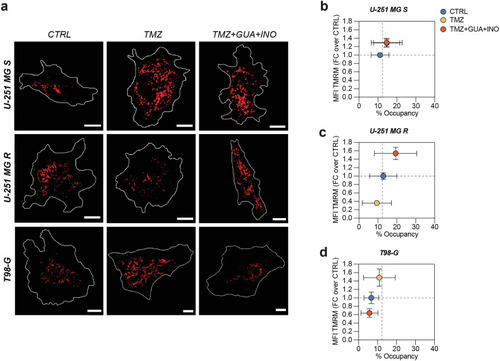
Resistant cells treated with TMZ, guanosine and inosine reshape their mitochondrial activity.

a Representative micrographs of TMRM staining in CTRL, TMZ-treated and TMZ + GUA + INO-treated cells for U-251 MG S, U-251 MG R, T98-G. Scale bar = 10 μm. bd Correlated quantification between MFI TMRM in FC over CTRL and % of occupancy for U-251 MG S (b), U-251 MG R (c) and T98- G (d). For U-251 MG S, CTRL: n = 49 cells from 4 biological replicates; TMZ: n = 46 cells from 4 biological replicates; TMZ + GUA + INO: n = 45 cells from 4 biological replicates. For U-251 MG R, CTRL: n = 46 cells from 4 biological replicates; TMZ: n = 33 cells from 4 biological replicates; TMZ + GUA + INO: n = 38 cells from 4 biological replicates. For T98-G, CTRL: n = 25 cells from 4 biological replicates; TMZ: n = 31 cells from 4 biological replicates; TMZ + GUA + INO: n = 27 cells from 4 biological replicates. Data are shown via scatter plots as mean ± SD. CTRL control, FC fold change, GUA guanosine, INO inosine, MFI mean fluorescence intensity, TMZ temozolomide.

Acknowledgments
This image is the copyrighted work of the attributed author or publisher, and ZFIN has permission only to display this image to its users. Additional permissions should be obtained from the applicable author or publisher of the image. Full text @ Cell Death Dis.