FIGURE

Fig. 6

ID
ZDB-FIG-250428-65
Publication
D'Aprile et al., 2025 - Purine metabolism rewiring improves glioblastoma susceptibility to temozolomide treatment
Other Figures
All Figure Page
Back to All Figure Page
Fig. 6

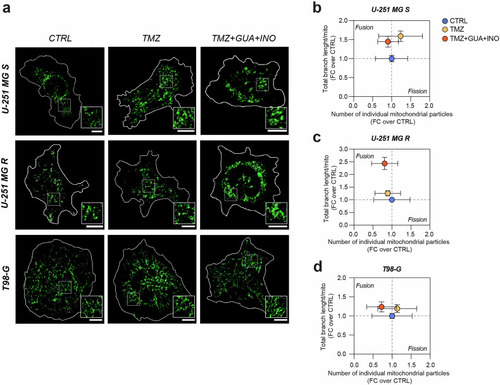
Guanosine and inosine, in combination with TMZ, stimulate mitochondrial fusion.

a Representative micrographs of MitoView staining in CTRL, TMZ-treated and TMZ + GUA + INO-treated cells for U-251 MG S, U-251 MG R, T98-G. Scale bar = 10 μm. bd Correlated quantification between total branch length/mito and number of individual mitochondrial particles in FC over CTRL for U-251 MG S (b), U-251 MG R (c) and T98- G (d). For U-251 MG S, CTRL: n = 37 cells from 4 biological replicates; TMZ: n = 33 cells from 4 biological replicates; TMZ + GUA + INO: n = 37 cells from 4 biological replicates. For U-251 MG R, CTRL: n = 26 cells from 4 biological replicates; TMZ: n = 45 cells from 4 biological replicates; TMZ + GUA + INO: n = 34 cells from 4 biological replicates. For T98-G, CTRL: n = 39 cells from 4 biological replicates; TMZ: n = 46 cells from 4 biological replicates; TMZ + GUA + INO: n = 40 cells from 4 biological replicates. Data are shown via scatter plots as mean ± SD. CTRL control, FC fold change, GUA guanosine, INO inosine, TMZ temozolomide.

Expression Data

Expression Detail
Antibody Labeling
Phenotype Data

Phenotype Detail
Acknowledgments
This image is the copyrighted work of the attributed author or publisher, and ZFIN has permission only to display this image to its users. Additional permissions should be obtained from the applicable author or publisher of the image. Full text @ Cell Death Dis.