IMAGE

Fig. 7

ID
ZDB-IMAGE-250428-67
Source
Figures for D'Aprile et al., 2025
Image
Figure Caption

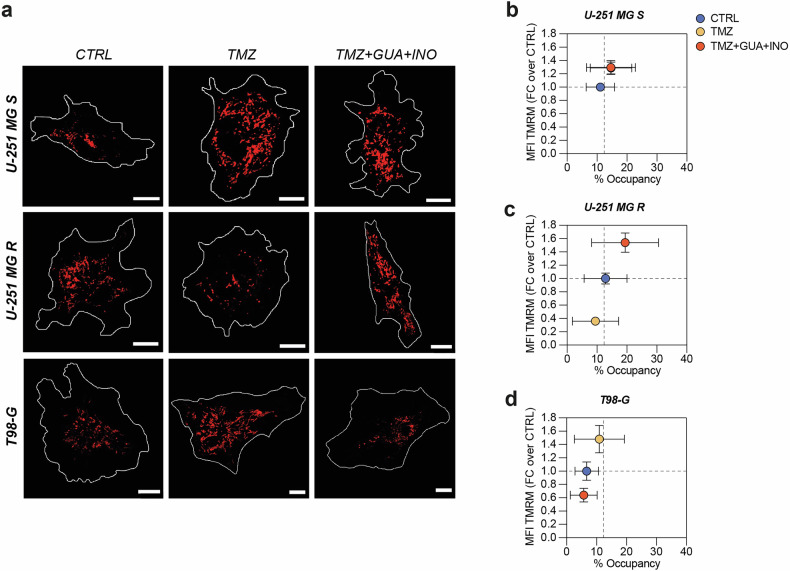
Fig. 7 Resistant cells treated with TMZ, guanosine and inosine reshape their mitochondrial activity.

a Representative micrographs of TMRM staining in CTRL, TMZ-treated and TMZ + GUA + INO-treated cells for U-251 MG S, U-251 MG R, T98-G. Scale bar = 10 μm. bd Correlated quantification between MFI TMRM in FC over CTRL and % of occupancy for U-251 MG S (b), U-251 MG R (c) and T98- G (d). For U-251 MG S, CTRL: n = 49 cells from 4 biological replicates; TMZ: n = 46 cells from 4 biological replicates; TMZ + GUA + INO: n = 45 cells from 4 biological replicates. For U-251 MG R, CTRL: n = 46 cells from 4 biological replicates; TMZ: n = 33 cells from 4 biological replicates; TMZ + GUA + INO: n = 38 cells from 4 biological replicates. For T98-G, CTRL: n = 25 cells from 4 biological replicates; TMZ: n = 31 cells from 4 biological replicates; TMZ + GUA + INO: n = 27 cells from 4 biological replicates. Data are shown via scatter plots as mean ± SD. CTRL control, FC fold change, GUA guanosine, INO inosine, MFI mean fluorescence intensity, TMZ temozolomide.

Acknowledgments
This image is the copyrighted work of the attributed author or publisher, and ZFIN has permission only to display this image to its users. Additional permissions should be obtained from the applicable author or publisher of the image. Full text @ Cell Death Dis.