
FIGURE
Fig. 4
- ID
- ZDB-FIG-250428-63
- Publication
- D'Aprile et al., 2025 - Purine metabolism rewiring improves glioblastoma susceptibility to temozolomide treatment
- Other Figures
- All Figure Page
- Back to All Figure Page
Fig. 4
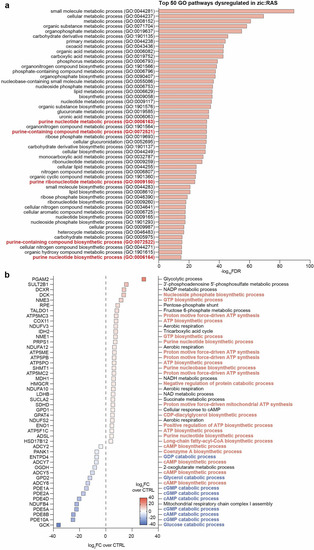
GBM zebrafish model shows increased purine biosynthesis and reduced purine catabolism. |
Expression Data
Expression Detail
Antibody Labeling
Phenotype Data
Phenotype Detail
Acknowledgments
This image is the copyrighted work of the attributed author or publisher, and
ZFIN has permission only to display this image to its users.
Additional permissions should be obtained from the applicable author or publisher of the image.
Full text @ Cell Death Dis.