|
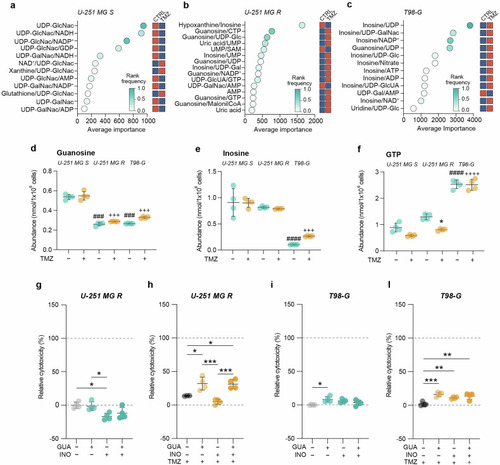
Guanosine and inosine are involved in TMZ resistance. a–c Metabolite ratio analysis plots, representing ratios with higher average importance for U-251 MG S (a), U-251 MG R (b) and T98-G (c). Blue squares indicate lower levels or ratios between metabolites and red squares indicate higher levels or ratios between metabolites in CTRL vs TMZ. d Guanosine abundance (expressed as nmol/1 × 106 cells) in CTRL versus TMZ-treated cells for U-251 MG S, U-251 MG R and T98-G. e Inosine abundance (expressed as nmol/1 × 106 cells) in CTRL versus TMZ-treated cells for U-251 MG S, U-251 MG R and T98-G. f GTP abundance (expressed as nmol/1 × 106 cells) in CTRL versus TMZ-treated cells for U-251 MG S, U-251 MG R and T98-G. Data are shown via scattered dot plots as mean ± SD of n = 4 independent experiments. g LDH assay at 24 h on U-251 MG R, CTRL or treated with guanosine and/or inosine. h LDH assay at 24 h on U-251 MG R, treated with TMZ and/or guanosine/inosine. i LDH assay at 24 h on T98-G, CTRL or treated with guanosine and/or inosine. l LDH assay at 24 h on T98-G, treated with TMZ and/or guanosine/inosine. Data are shown via scattered dot plots as mean ± SD of n ≥ 3 independent experiments. *p-value < 0.05; **p-value < 0.01; ***p-value < 0.001 vs untreated or between groups; ###p-value < 0.001; ####p-value < 0.0001 vs untreated U-251 MG S; +++p-value < 0.001; ++++p-value < 0.0001 vs TMZ treated U-251 MG S. CTRL control, GUA guanosine, INO inosine, TMZ temozolomide.
|