
- Title
-
Soy Protein-Cultured Mesenchymal Stem Cell-Secreted Extracellular Vesicles Target the Neurovascular Unit: Insights from a Zebrafish Brain Injury Model
- Authors
- Lin, T.I., Hsieh, P.Y., Lin, H.J., Chiang, C.K., Sheu, J.J., Chang, W.T., Liau, I., Hsu, H.Y.
- Source
- Full text @ ACS Biomater Sci Eng
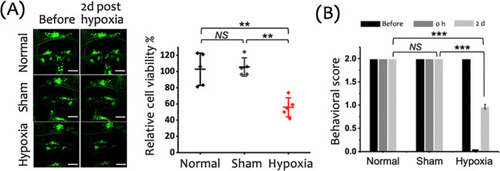
Evaluation of cerebral cell viability and neurological deficits in zebrafish larvae following a 15 min hypoxic insult. (A) Left: Representative fluorescence images of cranial motor neurons (green: GFP) in zebrafish larvae, captured before and 2 days after the hypoxic insult. Scale bar: 50 μm. Right: Quantification of relative cerebral cell viability reveals a significant decrease in the Hypoxia group compared to the Normal and Sham groups. Data are shown as mean ± SD with individual data points (n = 5 larvae per group). (B) Behavioral assessment of neurological function in zebrafish larvae conducted before the hypoxic insult (before), immediately after (0 h), and 2 days posthypoxia (2 d). Behavioral scores significantly declined in the Hypoxia group compared to both Normal and Sham groups at 2 days postinsult. Data are presented as mean ± SD from three independent experiments (n = 30 larvae per experiment). ***p < 0.001, **p < 0.01, *p < 0.05, and NS: not significant. |
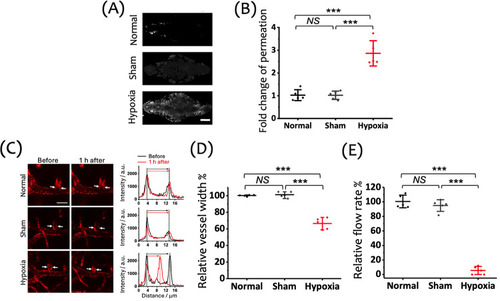
Effects of a 15 min hypoxic insult on BBB integrity, vasculature structure, and cerebral blood flow in zebrafish larvae, assessed 1 h postinsult. (A) Representative images of the cranial region showing the extravascular accumulation of fluorescent tracers (gray: RITC-dextran, MW: 10 k), 1 h posthypoxia following vascular injection, indicating BBB disruption in the Hypoxia group. Scale bar: 100 μm. (B) Fold change in tracer permeation, highlighting a significant increase in BBB permeability in the Hypoxia group compared to the Normal and Sham groups. (C) Left: Representative images of cerebral vasculature (red: mCherry) in zebrafish larvae before and 1 h after the 15 min hypoxic insult. White arrows indicate the proximal region of the first branch of the central artery (CtA1st), where vessel width measurements were taken. Scale bar: 20 μm. Right: Cross-sectional fluorescence intensity profiles showing vessel width changes pre- and posthypoxia. (D) Quantification of the relative vessel width in the CtA1st across the Normal, Sham, and Hypoxia groups, showing a significant reduction in the Hypoxia group. (E) Relative flow rate in the CtA1st, demonstrating a significant reduction in the Hypoxia group compared to the Normal and Sham groups. Data are shown as mean ± SD with individual data points (n = 5 larvae per group) in panels (B), (D), and (E). |
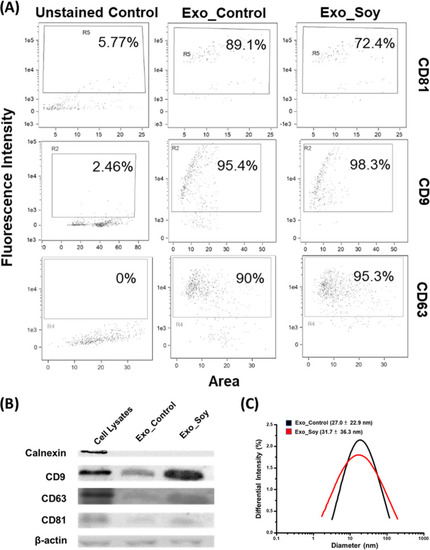
Characterization of exosomes. WJ-MSC-secreted exosomes collected from soy protein-coated (Exo_Soy) and uncoated (Exo_Control) culture dishes were, respectively, characterized for the surface markers CD81, CD9, and CD63 by (A) flow cytometric analyzer (ImageStreamX Mark II, Amnis) and (B) Western blot (Calnexin served as the negative marker of exosomes, and β-actin is the loading control). (C) DLS analysis was performed to characterize the respective diameters of these exosomes. |
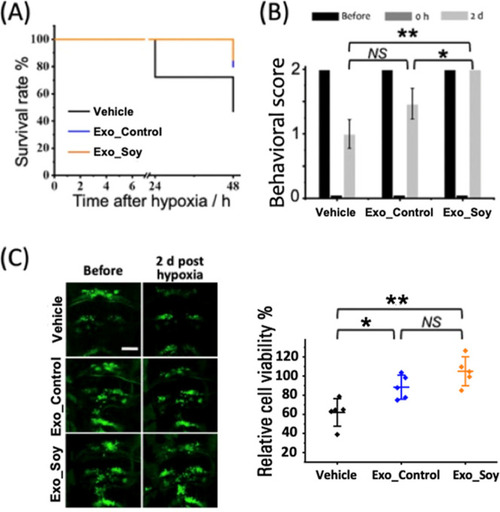
Therapeutic effect of exosomes on larval survival, neurological function, and cerebral cell viability. (A) Survival curve of zebrafish larvae (6 dpf) treated with vehicle, control exosomes (Exo_Control), or soy-derived exosomes (Exo_Soy) posthypoxia. Data represent n = 60 larvae per group. (B) Behavioral assessment of neurological function, evaluated immediately after hypoxia (0 h) and 2 days posthypoxia (2 d). Data are presented as mean ± SD from three independent experiments with n = 5 larvae per experiment. (C) Left: Representative fluorescence images of cranial motor neurons (green: GFP-labeled) in zebrafish larvae, acquired before and 2 days posthypoxia. Scale bar: 50 μm. Right: Quantification of relative cerebral cell viability at 2 days posthypoxia in the Vehicle, Exo_Control, and Exo_Soy groups. Data are presented as mean ± SD with individual data points (n = 5 per group). |
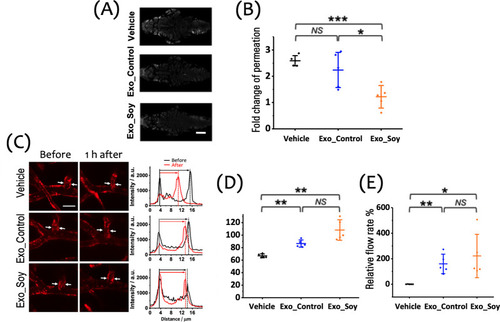
Therapeutic effect of exosomes on the function and integrity of the NVU. (A) Representative images of extravascular fluorescent tracer accumulation in the cranial region of zebrafish larvae 1 h posthypoxia, illustrating the degree of BBB disruption under each treatment condition (gray: RITC-dextran, MW: 10 k). Scale bar: 100 μm. (B) Quantitative analysis of fold change in tracer permeation, indicating BBB integrity across the Vehicle, Exo_Control, and Exo_Soy groups (n = 5 per group). (C) Left: Representative images of the cerebral vasculature in zebrafish larvae treated with Vehicle, Exo_Control, or Exo_Soy after a 15 min hypoxic insult (red: mCherry). White arrows point to the regions where vessel width measurements were taken. Right: Cross-sectional fluorescence intensity profiles along the cerebral vessels, illustrating changes before and 1 h after hypoxia in each treatment group. Scale bar: 20 μm. (D) Quantitative analysis of the relative vessel width, showing that Exo_Soy significantly preserves the vessel width compared to the Vehicle group, while Exo_Control displays a similar trend. (E) Quantitative analysis of the relative cerebral blood flow, demonstrating significant improvement in the Exo_Soy group compared to the Vehicle group, with Exo_Control showing comparable efficacy. Data are shown as mean ± SD with individual data points (n = 5 larvae per group) in panels (B), (D), and (E). |
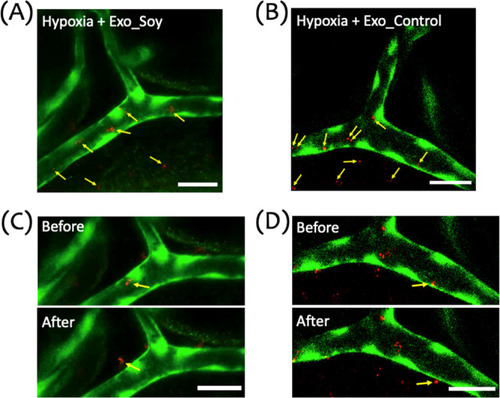
Distribution and extravasation of exosomes in a zebrafish hypoxic brain injury model. (A,B) Representative image of the cranial vasculature in zebrafish larvae subjected to a 15 min hypoxic insult, followed by microinjection of DiI-labeled Exo_Soy (A) or Exo_Control (B) exosomes. The image illustrates the distribution of exosomes within and outside the vasculature. Green represents the vasculature (GFP), and red indicates exosomes (DiI). Yellow arrows point to exosomes located both inside the vessel and those that have extravasated across the vascular wall. (C,D) Sequential images showing exosome migration and extravasation in hypoxia-exposed larvae. Panels illustrate Exo_Soy (C) and Exo_Control (D) before (top) and after (bottom) crossing the vascular wall. Yellow arrows mark exosomes transitioning from intravascular to extravascular regions. Scale bar: 20 μm. |
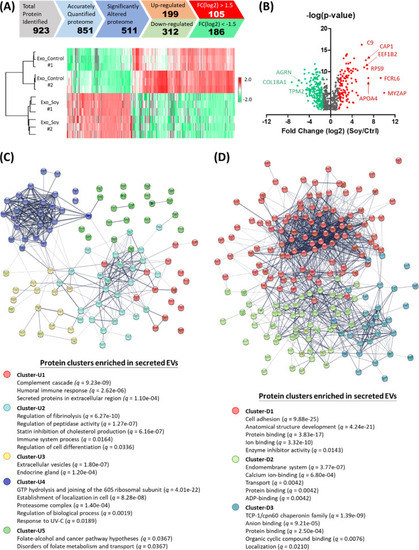
LC–MS/MS proteomic analysis of soy protein-cultured MSC-secreted exosomes. (A) 511 differentially expressed proteins (199 upregulated plus 312 downregulated) were identified by Student’s t-test (permutation-based FDR <0.05) (top); reproducibility of the analysis: both control and soy protein-cultured MSC-secreted EV samples were collected within the same batch (n = 3) and batches on the different days (#1 and #2) (bottom). (B) Volcano plots of proteins identified in LC–MS/MS. The red and green dots represent the upregulated and downregulated proteins, respectively (p < 0.05 and fold change: ±1.5). (C) Upregulated and (D) downregulated proteins were categorized into 5 (up: U1–U5) and 3 (down: D1–D3) functional clusters based on the STRING protein–protein interactome. The top-five key pathways enriched in each cluster with q-values less than 0.05 were presented. |
|