
|
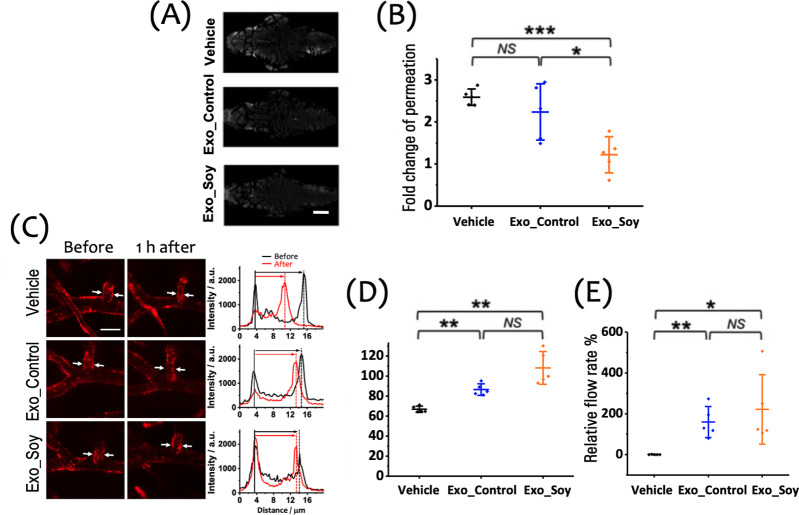
Fig. 5 Therapeutic effect of exosomes on the function and integrity of the NVU. (A) Representative images of extravascular fluorescent tracer accumulation in the cranial region of zebrafish larvae 1 h posthypoxia, illustrating the degree of BBB disruption under each treatment condition (gray: RITC-dextran, MW: 10 k). Scale bar: 100 μm. (B) Quantitative analysis of fold change in tracer permeation, indicating BBB integrity across the Vehicle, Exo_Control, and Exo_Soy groups (n = 5 per group). (C) Left: Representative images of the cerebral vasculature in zebrafish larvae treated with Vehicle, Exo_Control, or Exo_Soy after a 15 min hypoxic insult (red: mCherry). White arrows point to the regions where vessel width measurements were taken. Right: Cross-sectional fluorescence intensity profiles along the cerebral vessels, illustrating changes before and 1 h after hypoxia in each treatment group. Scale bar: 20 μm. (D) Quantitative analysis of the relative vessel width, showing that Exo_Soy significantly preserves the vessel width compared to the Vehicle group, while Exo_Control displays a similar trend. (E) Quantitative analysis of the relative cerebral blood flow, demonstrating significant improvement in the Exo_Soy group compared to the Vehicle group, with Exo_Control showing comparable efficacy. Data are shown as mean ± SD with individual data points (n = 5 larvae per group) in panels (B), (D), and (E).