
|
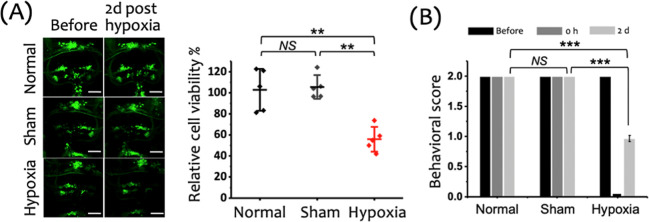
Fig. 1 Evaluation of cerebral cell viability and neurological deficits in zebrafish larvae following a 15 min hypoxic insult. (A) Left: Representative fluorescence images of cranial motor neurons (green: GFP) in zebrafish larvae, captured before and 2 days after the hypoxic insult. Scale bar: 50 μm. Right: Quantification of relative cerebral cell viability reveals a significant decrease in the Hypoxia group compared to the Normal and Sham groups. Data are shown as mean ± SD with individual data points (n = 5 larvae per group). (B) Behavioral assessment of neurological function in zebrafish larvae conducted before the hypoxic insult (before), immediately after (0 h), and 2 days posthypoxia (2 d). Behavioral scores significantly declined in the Hypoxia group compared to both Normal and Sham groups at 2 days postinsult. Data are presented as mean ± SD from three independent experiments (n = 30 larvae per experiment). ***p < 0.001, **p < 0.01, *p < 0.05, and NS: not significant.