
|
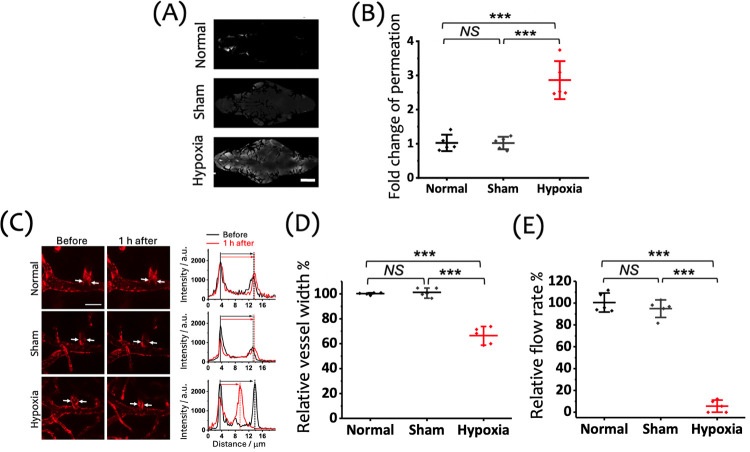
Fig. 2 Effects of a 15 min hypoxic insult on BBB integrity, vasculature structure, and cerebral blood flow in zebrafish larvae, assessed 1 h postinsult. (A) Representative images of the cranial region showing the extravascular accumulation of fluorescent tracers (gray: RITC-dextran, MW: 10 k), 1 h posthypoxia following vascular injection, indicating BBB disruption in the Hypoxia group. Scale bar: 100 μm. (B) Fold change in tracer permeation, highlighting a significant increase in BBB permeability in the Hypoxia group compared to the Normal and Sham groups. (C) Left: Representative images of cerebral vasculature (red: mCherry) in zebrafish larvae before and 1 h after the 15 min hypoxic insult. White arrows indicate the proximal region of the first branch of the central artery (CtA1st), where vessel width measurements were taken. Scale bar: 20 μm. Right: Cross-sectional fluorescence intensity profiles showing vessel width changes pre- and posthypoxia. (D) Quantification of the relative vessel width in the CtA1st across the Normal, Sham, and Hypoxia groups, showing a significant reduction in the Hypoxia group. (E) Relative flow rate in the CtA1st, demonstrating a significant reduction in the Hypoxia group compared to the Normal and Sham groups. Data are shown as mean ± SD with individual data points (n = 5 larvae per group) in panels (B), (D), and (E).