
|
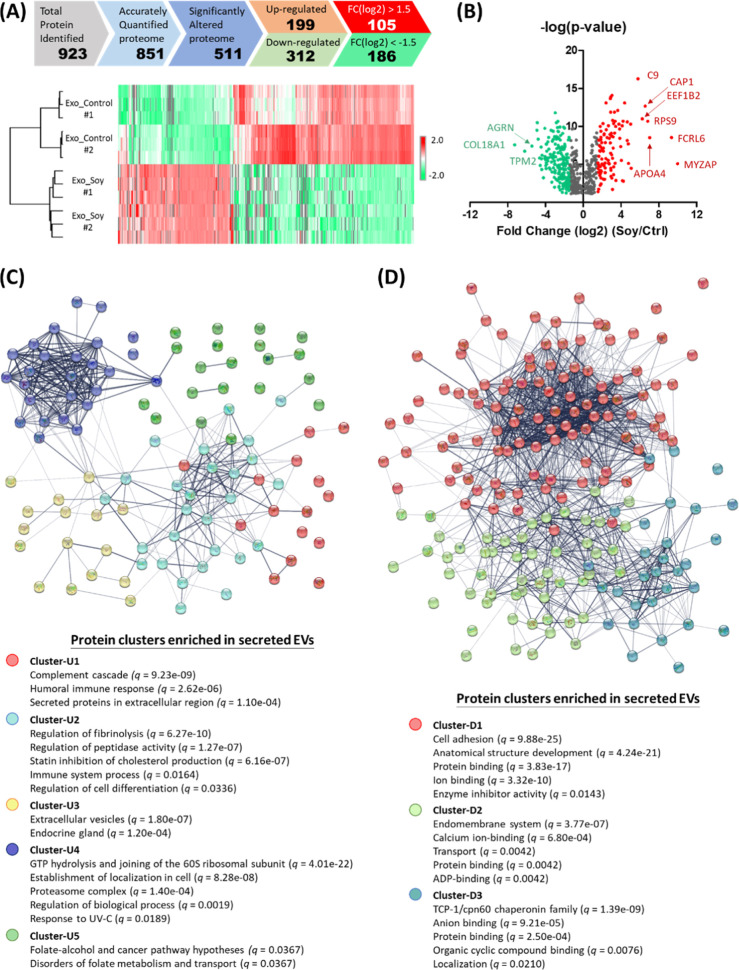
Fig. 7 LC–MS/MS proteomic analysis of soy protein-cultured MSC-secreted exosomes. (A) 511 differentially expressed proteins (199 upregulated plus 312 downregulated) were identified by Student’s t-test (permutation-based FDR <0.05) (top); reproducibility of the analysis: both control and soy protein-cultured MSC-secreted EV samples were collected within the same batch (n = 3) and batches on the different days (#1 and #2) (bottom). (B) Volcano plots of proteins identified in LC–MS/MS. The red and green dots represent the upregulated and downregulated proteins, respectively (p < 0.05 and fold change: ±1.5). (C) Upregulated and (D) downregulated proteins were categorized into 5 (up: U1–U5) and 3 (down: D1–D3) functional clusters based on the STRING protein–protein interactome. The top-five key pathways enriched in each cluster with q-values less than 0.05 were presented.