
- Title
-
Selisistat, a SIRT1 inhibitor, enhances paclitaxel activity in luminal and triple-negative breast cancer: in silico, in vitro, and in vivo studies
- Authors
- Wawruszak, A., Luszczki, J., Bartuzi, D., Kalafut, J., Okon, E., Czerwonka, A., Stepulak, A.
- Source
- Full text @ J Enzyme Inhib Med Chem
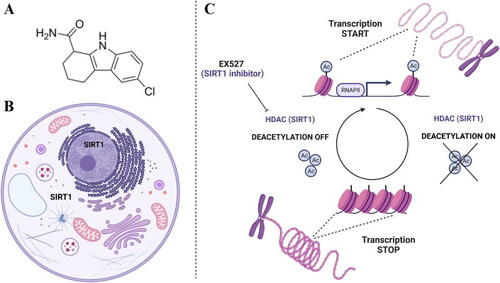
Histone acetylation modifications in cancer biology. (a) The chemical structure of selisistat (EX527) – sirtuin 1 (SIRT1) inhibitor. (b) Cellular localisation of SIRT1. (c) Inhibition of histone deacetylation (DEACETYLATION OFF) (catalyzed by SIRT1 (HDAC)) through EX527. After inhibition, HDACs are unable to remove acetyl groups (Ac) from the N-terminus lysine residues. This leads to an opened state of the chromatin and increases transcriptional activity of RNA polymerase II (RNAPII). |
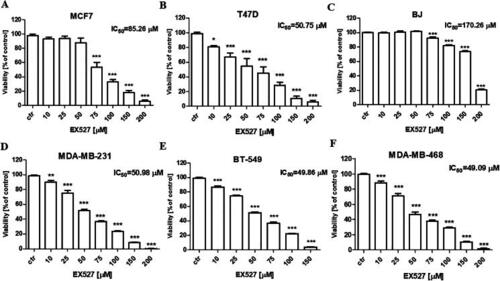
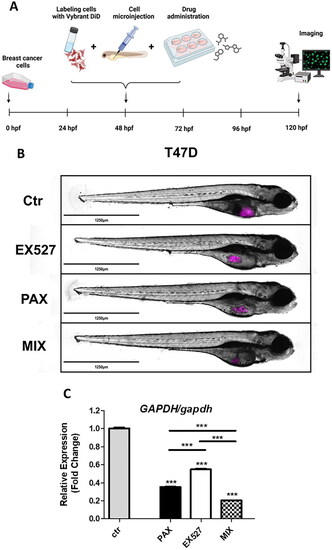
Evaluation of single drug-mediated effects on the viability of the (a) MCF7 and (b) T47D luminal A BC, (c) BJ normal, and (d) MDA-MB-231, (e) BT-549 and (f) MDA-MB-468 BC cells in the MTT assay. BC cells were exposed for 96 h to increasing EX527 concentrations (10–200 µM). The data are presented as the mean ± standard deviation (±SD) of the mean. * |
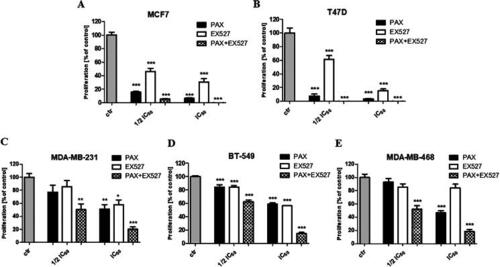
Evaluation of single or combined drug-mediated effects on the proliferation of (a) MCF7, (b) T47D, (c) MDA-MB-231, (d) BT-549, (e) MDA-MB-468 BC cells in the BrdU assay. BC cells were exposed for 48 h to 1/2 and IC50 PAX, EX527 or 1:1 PAX:EX527 (1/2 and IC50 mix). The data are presented as the mean ± standard deviation (±SD) of the mean. * |
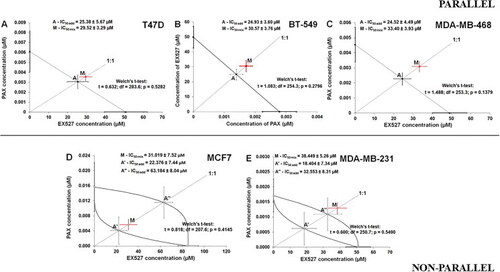
Isobolographic analysis of interaction between PAX and EX527 for parallel (a) T47D, (b) BT-549, (c) MDA-MB-468 and non-parallel (d) MCF7, (e) MDA-MB-231 concentration-response effects in BC cells in the MTT assay. The additive interactions between PAX and EX527 are displayed on isobolograms in T47D, BT-549, MDA-MB-468, MCF7 and MDA-MB-231 BC cells. The dotted diagonal line starting from the point (0,0) corresponds to the mixture of PAX and EX527 at the fixed ratio of 1:1. The points: A (on graphs A-C); A’ and A” (on graphs D-E) depicts the theoretically calculated IC50 add values for the isoboles of additivity for parallel and non-parallel concentration-response effects. The points M represents the IC50 mix values for the total concentrations of the experimental mixture of PAX and EX527 that exerted a 50% anti-viability effect (50% isobole) in the MTT assay. The SEM values are illustrated as horizontal and vertical error bars for every IC50 value. The combinations of PAX with EX527 in all analysed BC cell lines were additive in the MTT test because the IC50 mix values for these combinations are placed close to the points A, A’ or A’’. For more detailed information on the isobolographic representation of the data, please refer to |
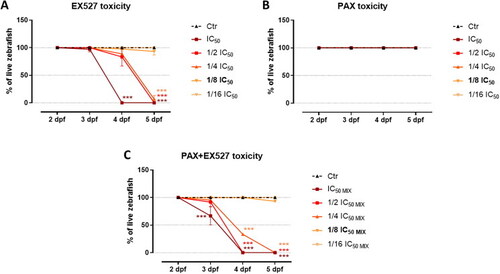
The percentage of zebrafish embryos initiated 2 days post-fertilization (dpf) that survived after 1, 2 or 3 days of treatment with indicated concentrations of (a) EX527, (b) PAX and (c) EX527:PAX (IC50 mix). IC50 drug doses refer to the effective therapeutic concentrations were determined earlier by the |
|
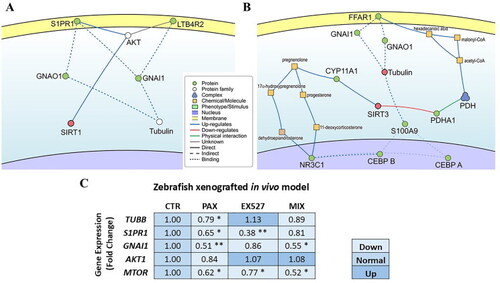
Schematic representation of molecular interaction pathways between (a) SIRT1 or (b) SIRT3 with tubulin, as indicated by SIGNOR. The diagram showcases the proteins and molecules involved in the interaction network between molecular targets of EX527 and PAX. Different shapes and colours denote the nature of the entities, as explained in the legend panel. (c) The effects of PAX, SIRT and PAX:SIRT (1/8 IC50 or 1/8 IC50 mix) on the gene expressions in zebrafish xenografted BT-549 TNBC |
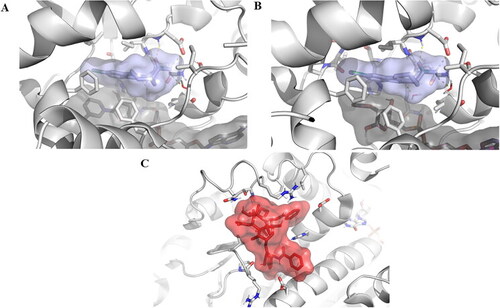
Experimentally solved structures of EX527 analogue bound to (a) SIRT1, as revealed by the PDB entry 4I5I. (b) EX527 bound to SIRT3 in the PDB entry 4BVH, (c) Taxol molecule bound to a tubulin unit, as presented by the PDB entry 6WVR. The distinct chemical nature of the ligands, variations in size, and differences in the characteristics of their respective binding pockets render it improbable for them to engage in competition for the same binding site. |
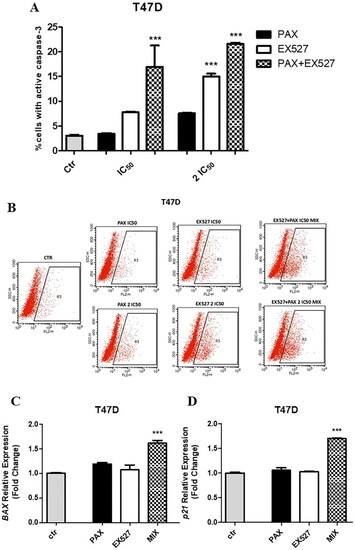
Evaluation of single or combined drug-mediated effects on the induction of apoptosis in T47D BC cells. (a) The % of cells with active caspase-3 determined after PAX and EX527 treatment for 48 h using selected ratios of the IC50 determined in the MTT assay. Data are presented as mean ± standard deviation (± SD) of the mean, *** |
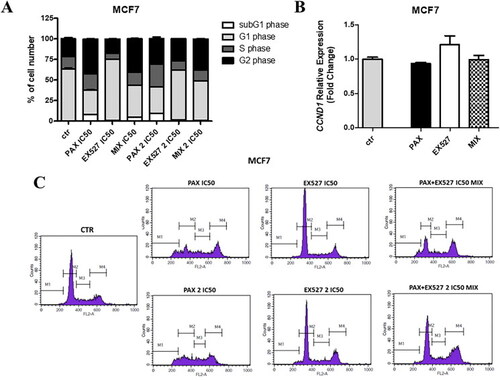
Effect of EX527 or/and PAX on the cell cycle progression in the MCF7 luminal BC cells. (a) BC cells were exposed to individual or concomitant EX527 and PAX treatment for 48 h using selected ratios of the IC50 determined in the MTT assay, stained with propidium iodide (PI) and analysed by FACS. The data are presented as the means ± standard deviation (±SD). (b) |