
Image
|
Figure Caption
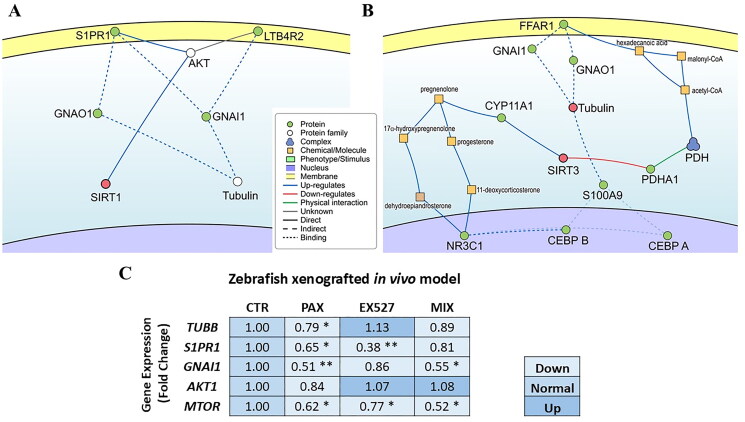
Figure 7.
Schematic representation of molecular interaction pathways between (a) SIRT1 or (b) SIRT3 with tubulin, as indicated by SIGNOR. The diagram showcases the proteins and molecules involved in the interaction network between molecular targets of EX527 and PAX. Different shapes and colours denote the nature of the entities, as explained in the legend panel. (c) The effects of PAX, SIRT and PAX:SIRT (1/8 IC50 or 1/8 IC50 mix) on the gene expressions in zebrafish xenografted BT-549 TNBC
Acknowledgments
This image is the copyrighted work of the attributed author or publisher, and
ZFIN has permission only to display this image to its users.
Additional permissions should be obtained from the applicable author or publisher of the image.
Full text @ J Enzyme Inhib Med Chem