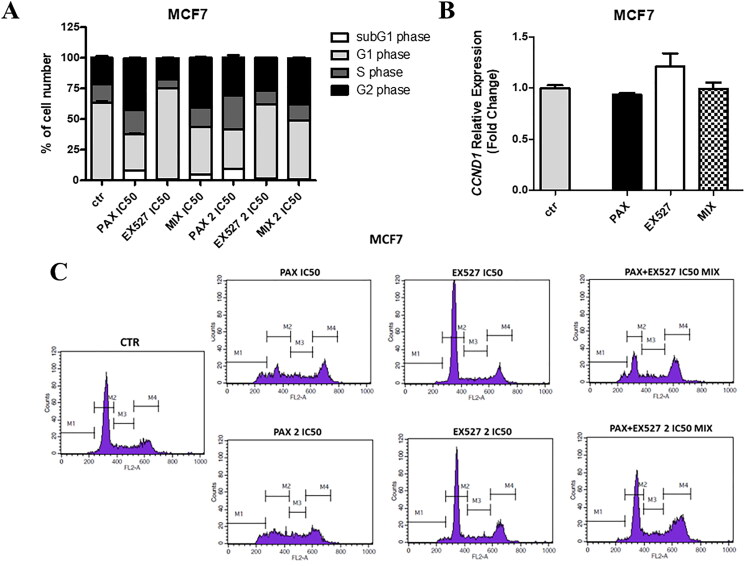
IMAGE

Figure 10.

ID
ZDB-IMAGE-250214-28
Source
Figures for Wawruszak et al., 2025
Image
Figure Caption

Figure 10.

Effect of EX527 or/and PAX on the cell cycle progression in the MCF7 luminal BC cells. (a) BC cells were exposed to individual or concomitant EX527 and PAX treatment for 48 h using selected ratios of the IC50 determined in the MTT assay, stained with propidium iodide (PI) and analysed by FACS. The data are presented as the means ± standard deviation (±SD). (b) CCND1 (cyclin D1) relative gene expression in zebrafish MCF7 injected xenograft model after 72 h with 1/8 IC50 EX527 or/and PAX treatment determined in qPCR method. (c) Representative histograms from the FACS analysis of the MCF7 BC cells after a 48h incubation with EX527 or/and PAX. M1-subG1 (pre-G1) phase; M2-G1 phase; M3-S phase; M4-G2 phase.

Acknowledgments
This image is the copyrighted work of the attributed author or publisher, and ZFIN has permission only to display this image to its users. Additional permissions should be obtained from the applicable author or publisher of the image. Full text @ J Enzyme Inhib Med Chem