
- Title
-
Repurposing of a gill gene regulatory program for outer ear evolution
- Authors
- Thiruppathy, M., Teubner, L., Roberts, R.R., Lasser, M., Moscatello, A., Chen, Y.W., Hochstim, C., Ruffins, S., Sarkar, A., Tassey, J., Evseenko, D., Lozito, T.P., Willsey, H.R., Gillis, J.A., Crump, J.G.
- Source
- Full text @ Nature

a, Schematics showing human outer-ear connective-tissue components derived from the first (red) and second (yellow) arch CNCCs. b, Carnegie stage (CS) human embryos show the fusion of the six hillocks of His (numbered) to form the outer ear (black arrow)48. c, Schematics showing the zebrafish pseudobranch (red) and gill filaments (blue) derived from the first and posterior (blue) pharyngeal-arch CNCCs, respectively. d, Haematoxylin and eosin-stained sections showing the fusion of five filaments at 17?d.p.f. into the pseudobranch (black arrows) at 90 d.p.f. (ref. 49). e?h, Miller?s stain reveals elastin (purple) in cartilage of the adult mouse outer ear (e) and various adult fish gills, including zebrafish (f, left), Atlantic salmon (g), gar, bowfin and bichir (h), but not in zebrafish jaw cartilage (f, right). Scale bars, 50?�m. See the Methods Statistics and reproducibility section for sample sizes. Credits: a and c, created by M.T. in BioRender (a, https://BioRender.com/n31b139 and https://BioRender.com/t64n385; c, https://BioRender.com/x90a752 and https://BioRender.com/a29d934); Carnegie embryos 6521 and 4570 in b were reproduced with permission from the National Museum of Health and Medicine48; the images in d were reproduced with permission from Keith Cheng, Jean Copper and Daniel Vanselow (http://bio-atlas.psu.edu/zf)49. |
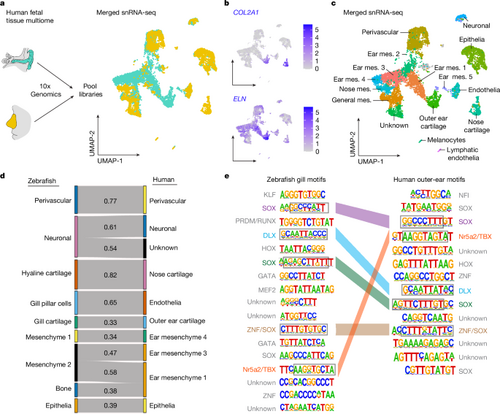
a, Scheme for human 22-week-old fetal tissue dissection, multiome and data analysis, with uniform manifold approximation and projections (UMAPs) of merged outer ear (turquoise) and nose (yellow) cells. b, Feature plots show human COL2A1 and ELN mRNA expression. c, Cluster identities for the merged snRNA-seq datasets; mes., mesenchyme. d, Sankey plot showing SAMap homology mapping of 14?d.p.f. zebrafish CNCC clusters and human fetal outer-ear and nose clusters. An alignment score threshold of 0.3 was used, with 1.0 representing perfect homology. e, All significantly enriched de novo DNA motifs in zebrafish gill versus hyaline cartilage and human outer ear versus nose cartilage DARs, and their putative transcription factor family binding. Coloured bars connect similar motifs between species, with common sequences in grey boxes. Credit: a, created by M.T. in BioRender (https://BioRender.com/e08f213 and https://BioRender.com/a53a784). |

a?d, Genome coverage plots show differential accessibility of Hs_GAS8-p1 and Hs_NRP2-p1 in human outer-ear versus nose cartilage (a) and differential accessibility of Hs_BMP2-p1 in human nose versus outer-ear cartilage (c). Numbers along x axes (a,c) indicate genomic coordinates. Chr., chromosome. Hs_GAS8-p1:GFP and Hs_NRP2-p1:GFP show restricted transgenic activity in zebrafish gill filaments at 14 d.p.f. (b). Hs_BMP2-p1:GFP shows restricted activity in zebrafish hyaline cartilage (d). e, Dr_ucmaa-p1:GFP shows restricted transgenic activity in zebrafish gill-filament cartilage; sox10:dsRed labels all cartilage in the merged images. f, Whole-mount X-gal staining shows that Dr_ucmaa-p1:lacZ drives reporter activity in the mouse outer ear (black arrow) at E15.5. g, Horizontal section through the outer ear shown in f, counterstained with nuclear fast red, shows expression in the pre-cartilage condensations (arrow) of the outer-ear canal but not in middle-ear hyaline cartilage (arrowhead). Scale bars, 50?�m. |

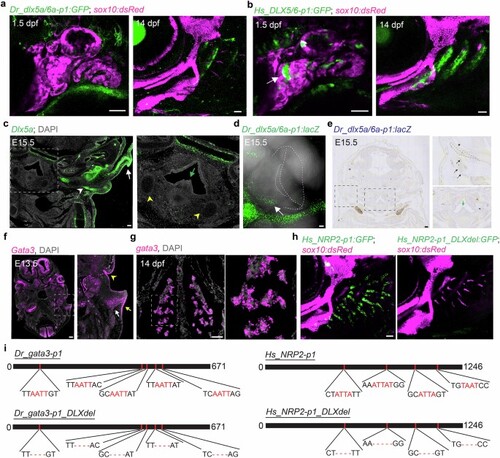
a, Workflow to identify gill developmental DARs with sequence conservation in humans. Genes with confirmed outer-ear or epiglottis expression of mouse homologues are shown in bold. b, Genome coverage plots show differential accessibility of Dr_dlx5a/6a-p1 in 3?d.p.f. zebrafish gills (top) and sequence-conserved region Hs_DLX5/6-p1 in human fetal outer ear (bottom). c, RNA in situ hybridization for Dlx5 in horizontal sections from an E13.5 mouse head. The magnified box region highlights expression in the outer-ear mesenchyme (arrow). d, RNA in situ hybridization for dlx5a in whole-mount zebrafish larva at 5?d.p.f. and in a section through zebrafish gills at 60?d.p.f. Arrows indicate expression in developing gills. Nuclei are labeled by DAPI. e,f, Dr_dlx5a/6a-p1:GFP (e) and Hs_DLX5/6-p1:GFP (f) drive similar reporter activity in the developing gills (boxed region, enlarged on the right) of zebrafish at 3?d.p.f. No activity of either transgene is seen in the tooth-forming seventh arch (arrow) or the pectoral fin (arrowhead). g, Whole-mount X-gal staining of an E13.5 Dr_dlx5a/6a-p1:lacZ mouse. Strong expression is seen in the neural tube (arrow) with weaker expression in the developing ear (boxed region). h, Sagittal section through a whole-mount X-gal-stained E15.5 Dr_dlx5a/6a-p1:lacZ mouse. Arrows indicate positive expression in the mesenchyme surrounding the ear-canal cartilage. Eam, external auditory meatus. i, Wild-type Dr_gata3-p1:GFP strongly labels the gills; Dr_gata3-p1_DLXdel:GFP shows greatly reduced gill activity but retains expression in the jaw joints (arrows) and hyomandibular?opercular joints (arrowheads); sox10:dsRed labels the cartilage. Scale bars: 100?�m in c, g and h; 50?�m in d?f and i. |
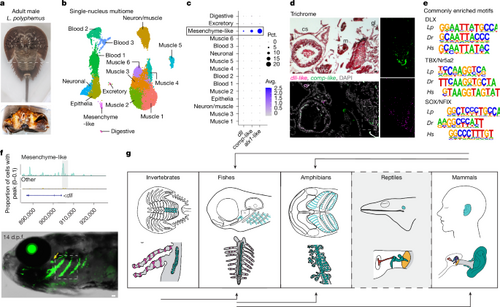
a, Adult male L. polyphemus with a dashed line indicating the dissection plane. Book gills (bottom) showing the region dissected for multiome (dashed box). b, Book-gill clusters annotated by cell type. c, Dot plot showing dll, comp-like and alx1-like expression in the mesenchyme-like cluster. Pct., percentage; Avg., average. d, Trichrome staining of a frontal section of a juvenile one-year-old horseshoe crab shows cardiac sinus (cs), medial midgut (mg), ventral nerve cord (vnc), lateral gill lamellae (gl), cartilage-like tissue (c) and muscle (m). RNA in situ hybridization of an adjacent section shows co-expression of dll and comp-like in mesenchyme-like cells at the growing edge of the cartilage (single channels on the right show the magnified box region). DAPI labels nuclei. e, Of 27 de novo motifs enriched in DARs from horseshoe crab (Lp) mesenchyme-like cells, 3 are conserved in DARs of zebrafish (Dr) gill cartilage and human (Hs) outer-ear cartilage. f, Top, genome coverage plot shows the differential accessibility of Lp_dll-p1 in mesenchyme-like cells. Bottom, Lp_dll-p1:GFP drives transgenic activity in the gills (boxed region) and in the gill-like pseudobranch (yellow arrow) at 14 d.p.f. g, Evolutionary model for the redeployment of the ancestral gill program across species. Top, putative locations of gill program-derived structures (turquoise) in invertebrates (horseshoe crab book gills), fishes (zebrafish gills), amphibians (Xenopus tadpole gills), reptiles (anole ear cavity) and mammals (human outer ear). Bottom, details of the structures, highlighting the elastic cartilage (green), respiratory cells (red) in the secondary lamellae of crabs and fishes, and ear structures of anoles and humans (columella/stapes, red; incus, blue; malleus, purple; tympanic membrane, yellow; outer ear canal, grey). Black arrows show where cross-species enhancer testing supports gill-program redeployment. For anoles, the dashed border and grey background denote a lack of enhancer testing. Scale bar, 50?�m. Credits: g, created by M.T. in BioRender (https://BioRender.com/c72e915, https://BioRender.com/p21u076, https://BioRender.com/q06o675, https://BioRender.com/v80c208, https://BioRender.com/t94e268, https://BioRender.com/b31e815, https://BioRender.com/c97i419 and https://BioRender.com/l10k434). |
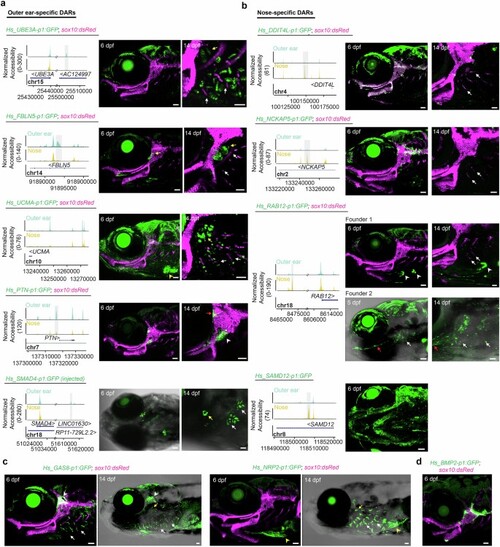
a,b, Genome coverage plots and zebrafish transgenic activity of human outer-ear-specific and nose-specific cartilage DARs. Except for Hs_SMAD4-p1:GFP-injected fish, all transgenic images are of stable lines. Lateral views of the head are shown at 5-6 dpf, and higher magnification views of the hyomandibular (hyaline) cartilage and gills are shown at 14 dpf. sox10:dsRed labels all cartilage. White arrows indicate the gill filaments and yellow arrows the gill-like pseudobranch. For Hs_UCMA-p1:GFP, a yellow arrowhead indicates heart expression at 6 dpf. For Hs_PTN-p1:GFP, a white arrowhead indicates mesenchymal expression near the hyomandibula and a red arrow labels a subset of hyomandibular-otic joint cells. For Hs_RAB12-p1:GFP, Founder 1 shows expression at the tips of the branchiostegal ray bones (arrowheads) and Founder 2 has weak and variable expression in the gill region (white arrows) in addition to the interopercular-mandibular ligament (red arrow). c, Additional images related to Fig. 3b,d show specificity of Hs_GAS8-p1:GFP for the gill filaments at 6 and 14 dpf and Hs_NRP2-p1:GFP for the gill filaments at 14 dpf. White arrowheads indicate labeling of trigeminal ganglia by Hs_GAS8-p1:GFP, and yellow arrowheads seventh arch mesenchyme labeling by Hs_NRP2-p1:GFP. d, Hs_BMP2-p1:GFP labels subsets of otic, hyomandibular, and ceratohyal hyaline cartilage at 6 dpf. Scale bars, 50?�m. |
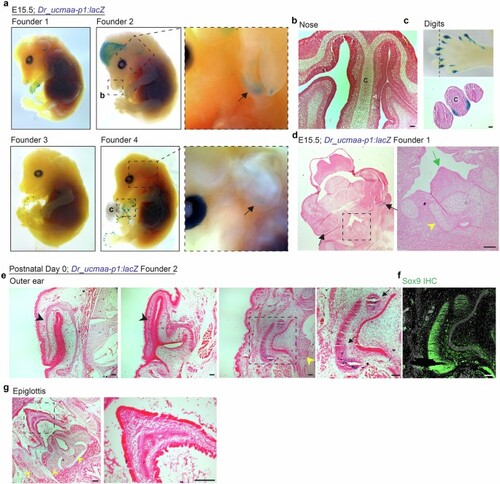
a, Representative images from whole-mount X-gal staining of Dr_ucmaa-p1:lacZ mice at E15.5 from 4 independent founder lines. Black arrows highlight outer-ear staining observed in 3 of 4 founders. We also observed digit expression in all 4 founders, nasal expression in Founders 1 and 2, and variable forebrain and weak hair follicle expression in Founder 2. b, Horizontal section through nose of Founder 2 shows activity in the olfactory epithelium (white arrowheads indicate rare cells) but not nasal hyaline cartilage (C). c, Magnified boxed region from Founder 4 shows positive staining in the mouse digit tips. Transverse section reveals expression in collateral ligaments surrounding the digit cartilage (C). d, Frontal section through Founder 1 shows expression in the outer ears (black arrows) but absence of expression in epiglottis (green arrow) and surrounding laryngeal hyaline cartilages (yellow arrowhead). e,g, X-gal staining of horizontal cryosections from the outer ear (e) and epiglottis (g) of Founder 2 P0 pups, showing activity in the ear canal cartilages (arrows) in boxed region of the third panel, but not in elastic cartilage of the pinna (black arrowheads) or epiglottis (boxed region in g). Hyaline cartilages of the middle ear and larynx (yellow arrowheads) are also negative. f, Sox9 immunostaining on adjacent sections confirms that the positive tissue of the outer ear is cartilage. All X-gal stained sections are counterstained with nuclear fast red. Scale bars, 50?�m (a-d), 100?�m (e-g). |

a, Scheme for human fetal tissue dissection, multiome, and data analysis, with UMAPs of merged datasets for two outer-ear replicates (teal, green), epiglottis (purple), and nose (yellow) cells. b, Feature plot shows COL2A1 mRNA expression, with arrows pointing to the two distinct COL2A1-high cartilage clusters. c, UMAPs by tissue identity. d, Cluster identities for the merged snRNAseq datasets. e, Bar chart plotting proportion of each cell type found within the different libraries. f, Violin plots showing COL2A1 and ELN mRNA expression in cells from the four cartilage clusters separated by tissue identity. g, Venn diagrams illustrating the proportion of ATAC peaks differentially accessible in outer-ear versus nose cartilage that are also differentially accessible in epiglottis versus nose cartilage. h, Coverage plots showing accessibility of human outer-ear elastic cartilage enhancers with cross-species gill-specific activity and nose cartilage enhancers with cross-species hyaline cartilage activity across all four human snATACseq libraries. Grey bars designate the peaks tested in transgenic assays. |
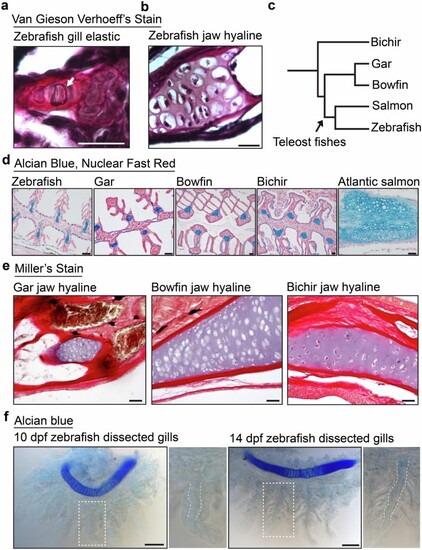
a,b, Van Gieson Verhoeff?s elastic staining on sections of adult zebrafish gill filaments (a) and jaw hyaline cartilage of the same animal (b). Blue-black fibers (white arrow) indicate positive staining. c, Phylogenetic tree depicting evolutionary relationships of fish species tested for elastin staining in their gill cartilages. d, Alcian blue counterstained with nuclear fast red on sections of gill-filament cartilage from adult zebrafish, gar, bowfin, bichir, and Atlantic salmon. e, Miller?s elastic staining on sections of jaw hyaline cartilage from adult gar, bowfin, and bichir. f, Whole-mount Alcian staining followed by gill dissection from 10 and 14 dpf zebrafish. Boxed regions are magnified to highlight late emerging Alcian blue-positive cartilage matrix in the gill filaments at 14 dpf when compared to the strongly staining ceratobranchial hyaline cartilage above. White dashed lines outline the primary gill-filament mesenchyme. Scale bars, 20?�m (a,b), 50 um (d-f). |
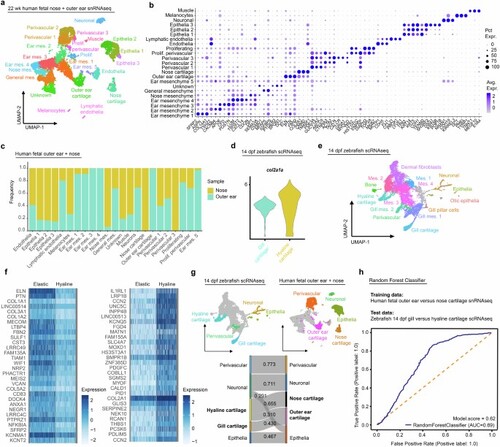
a, Merged human fetal outer ear and nose snRNAseq datasets with cell-type assignments for each cluster. b, Dot plot of genes selected from top 10 differentially expressed for each cluster. c, Bar chart plotting proportion of each cell type found within human fetal outer-ear versus nose libraries. d, Violin plot depicting expression of col2a1a in zebrafish 14 dpf hyaline versus gill elastic cartilage from previously published scRNAseq data3. e, Cell clusters from 14 dpf zebrafish CNCC scRNAseq used for SAMap analysis in Fig. 2d. f, Heatmaps showing top 30 differentially expressed genes in human outer-ear elastic versus nose hyaline cartilage. g, Top: Human fetal outer ear and nose and zebrafish 14 dpf CNCC clusters with cell types included in SAMap analysis colored. Bottom: Sankey plot showing cell-type homology mapping and alignment scores derived from SAMap analysis. An alignment score threshold of 0.25 was used. h, Receiver operating characteristic (ROC) curve plotted for random forest classifier trained on human fetal outer-ear and nose cartilage transcriptomes and tested on 14 dpf zebrafish gill and hyaline cartilage transcriptomes. |
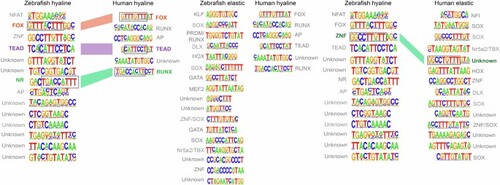
Colored bars connect similar motifs with closely matching sequences highlighted by grey boxes. Zebrafish hyaline and elastic cartilage are from facial and gill-filament cartilages, respectively. Human hyaline and elastic cartilage are from nose and outer ear, respectively. |

a,b, Genome coverage plots of snATACseq signal in 3 dpf zebrafish gill progenitors versus other CNCCs (top) and human outer-ear, epiglottis, and nose libraries (mesenchymal and cartilage cell types only) (bottom). Grey bars indicate regions of sequence conservation. The weak yet selective signals of some conserved peaks in human samples may reflect partial retention of accessibility from earlier usage of enhancers in outer ear (a) and epiglottis (b) development. c,d, In situ hybridization for mouse homologs of genes linked to sequence-conserved gill developmental DARs. Staining of sagittal sections of E14.5 mouse embryos are reproduced from GenePaint19. Magnified boxed regions on right highlight expression associated with the outer-ear canal with red dashed lines outlining the ear canal lumen (c), and larynx with red dashed lines outlining the epiglottis (d). Scale bars, 500?�m. |
a,b, Dr_dlx5a/6a-p1:GFP and Hs_DLX5/6-p1:GFP are not active in the known ventral arch CNCC expression domain of dlx5a in 1.5 dpf zebrafish. White arrow indicates activity of Hs_DLX5/6-p1:GFP in the first endodermal pouch. At 14 dpf, both enhancers are active at the bases of gills but not in elastic cartilage. sox10:dsRed labels CNCCs at 1.5 dpf and cartilage at 14 dpf. c, RNA in situ hybridization for Dlx5 in frontal sections of an E15.5 mouse head shows expression in developing outer-ear canal (arrowhead) and pinna (arrow). Magnified box region highlights absence of expression in the epiglottis (green arrow) and hyaline hyoid cartilages (yellow arrowheads). d, Endogenous fluorescence of X-gal reaction product shows Dr_dlx5a/6a-p1:lacZ labels outer ear mesenchyme (arrow) adjacent to outer-ear canal (white solid outline) but not the pinna (white dashed outline) in E15.5 mouse embryo. e, Frontal section of whole-mount X-gal stained Dr_dlx5a/6a-p1:lacZ mouse embryo. Magnified boxed regions show expression in mesenchyme (black arrows) associated with elastic cartilage (dashed outlines) lining the external auditory meatus (asterisk), and absence of expression in the epiglottis (green arrow). f, RNA in situ hybridization for Gata3 in horizontal sections of E13.5 mouse head. Magnified boxed region highlights expression in the mesenchyme (white arrow) and epithelium (yellow arrow) of the pinna, and ear canal epithelia (yellow arrowhead). g, RNA in situ hybridization for gata3 in horizontal sections of 14 dpf zebrafish. Magnified boxed region highlights expression in gill-filament mesenchyme and epithelia. h, Compared to activity of unaltered Hs_NRP2-p1:GFP transgene in gill filament cartilages at 17 dpf, loss of DLX sites in Hs_NRP2-p1_DLXdel:GFP abolishes gill activity. sox10:dsRed labels cartilage. i, Schematic of DLX motif deletions. Scale bars, 50?�m (a,b,g,h), 100?�m (c-f). |
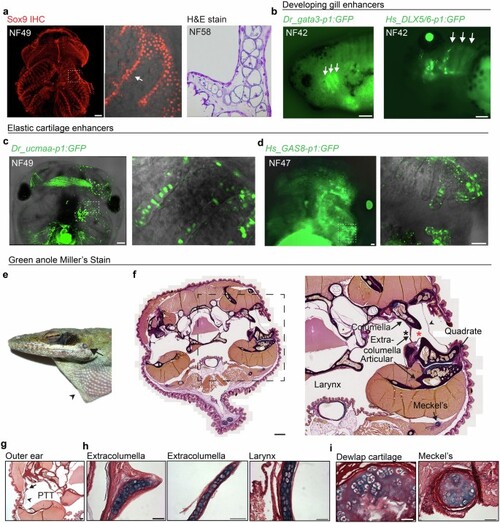
a, Whole-mount Sox9 immunostaining of cartilage in an NF49 Xenopus laevis tadpole head (ventral view, anterior up). Magnified boxed region highlights gill filter cartilage (arrow). H&E stain on a comparable section through the gill filters of an NF58 tadpole shows cellular cartilage (reproduced from Figure S2e in ref. 23). b, White arrows highlight gata3-p1:GFP (left) and Hs_DLX5/6-p1:GFP (right) activity in the developing gills of NF42 tadpoles, which persisted up to late tadpole stages NF47-49. c,d, Elastic cartilage enhancers Dr_ucmaa-p1:GFP (c) and Hs_GAS8-p1:GFP (d) drove reporter activity in gill filter cartilage (magnified boxed regions) in NF47-49 tadpoles. No expression was seen in the early developing gills at NF42 from either construct. Expression is unilateral due to injection of one cell at the two-cell stage, with non-specific muscle fluorescence. e, Adult head of a green anole (Anolis carolensis) showing the shallow outer ear (arrow) and dewlap (arrowhead). f-i, Miller?s Stain of frontal sections through the green anole head. Boxed magnified region in f shows anatomy surrounding the pharyngotympanic tube (black asterisk). The extracolumella, attached to the columella, extends processes into the pharyngotympanic tube and towards the tympanic membrane (arrowhead). The short outer ear canal (red asterisk) sits directly above the jaw joint, comprising the articular and quadrate bones, and Meckel?s cartilage is ventral to the jaw joint. Compared to the extracolumella permanent cartilage, the columella has completely ossified. The pharyngotympanic tube (PTT) and tympanic membrane (arrowhead) supported by the extracolumella (arrow) are highlighted in g. Higher magnification images contrast the cellular nature and strong Miller?s stain of the extracolumella and laryngeal elastic cartilages (h) with the permanent hyaline dewlap and Meckel?s cartilages (i). Scale bars, 200?�m (a, c,f), 50?�m (b,d,g-i). |
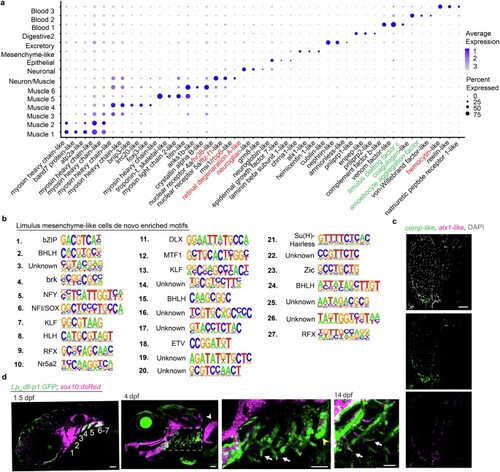
a, Dot plot of genes from top 10 differentially expressed for each cluster. Gene names assigned based on predicted homology of their encoded proteins with vertebrate or invertebrate proteins as determined using blastp. Those in black are from predicted homology with vertebrate proteins, in red from predicted homology with Drosophila proteins, and in green proteins that have been characterized in Limulus species. b, De novo motif enrichment analysis conducted on DARs identified from the cluster of horseshoe crab mesenchyme-like cells. c, RNA in situ hybridization for comp-like and alx1-like genes on a frontal section of a juvenile horseshoe crab book gill cartilage show co-enrichment in mesenchyme-like cells along the growing tip of the cartilage. Merged channel with DAPI to highlight nuclei is shown at top, with individual channels below. d, Lp_dll-p1:GFP drives transgenic reporter activity in the gill-forming posterior pharyngeal arch CNCCs (4?7) at 1.5 dpf, and in the base and developing filaments of gills (boxed region) at 4 and 14 dpf. Transgene activity is also seen in the tooth-forming seventh arch (yellow arrowhead), but not in the pectoral fin (white arrowhead). sox10:dsRed labels CNCCs at 1.5 dpf and cartilage at 4 and 14 dpf. Scale bars, 50?�m. |